Open menu

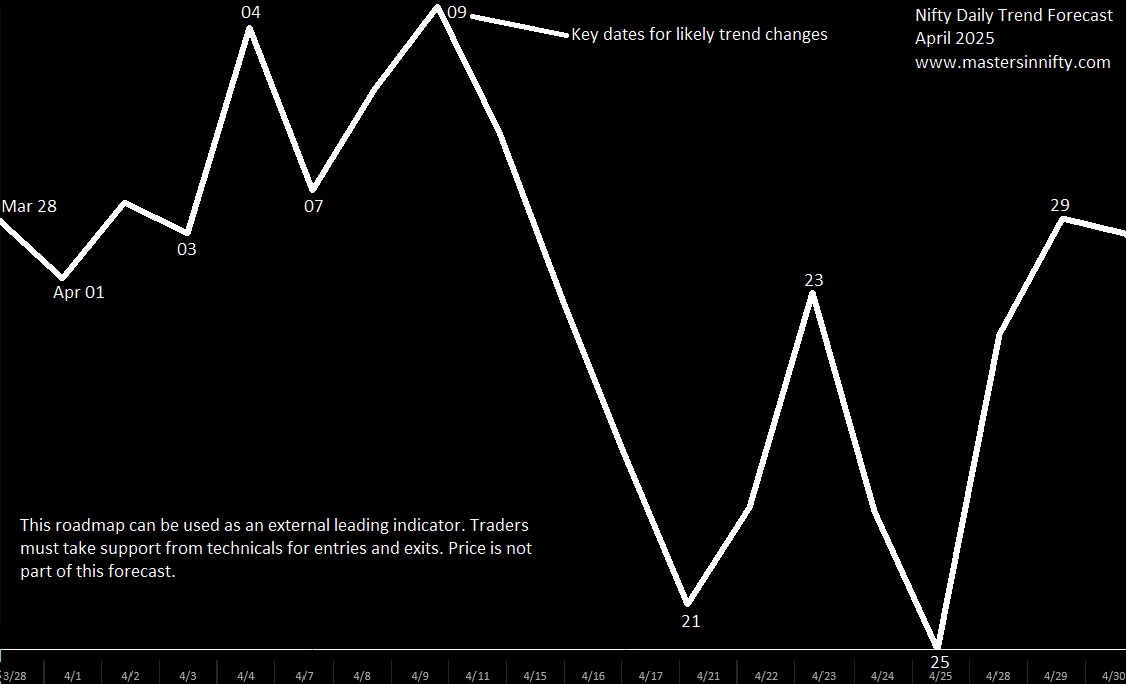
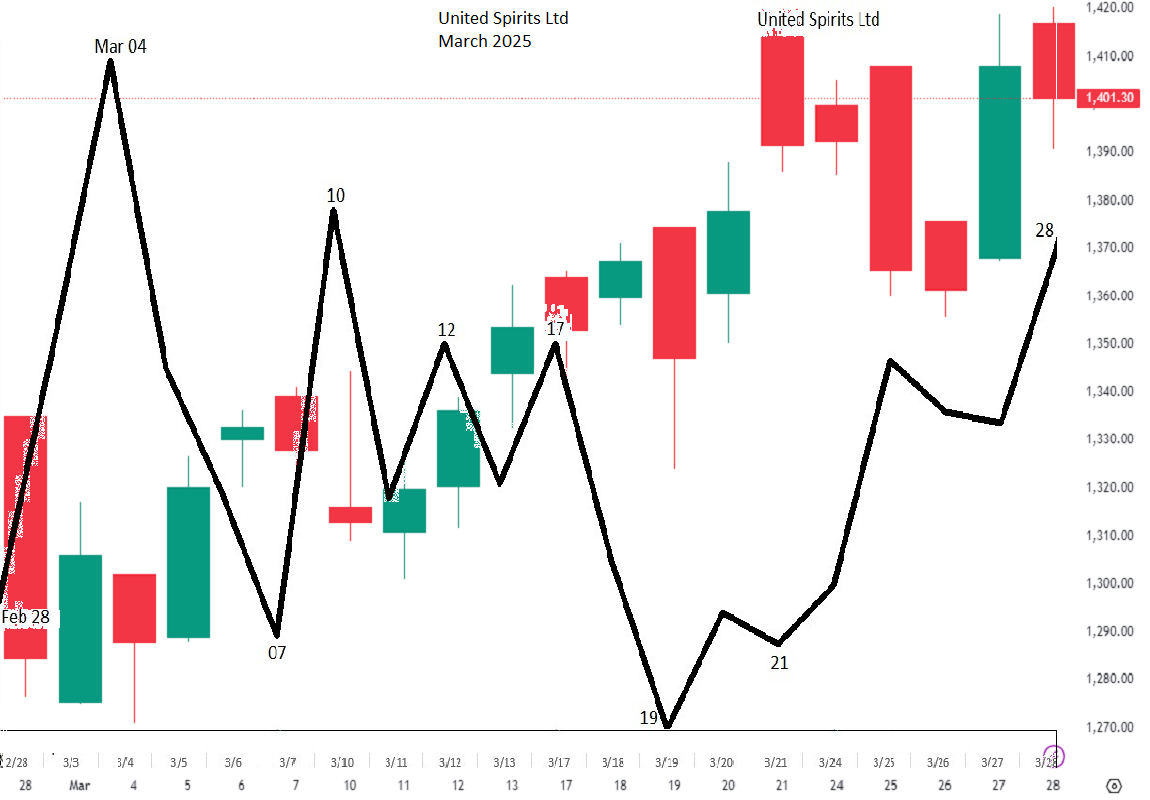
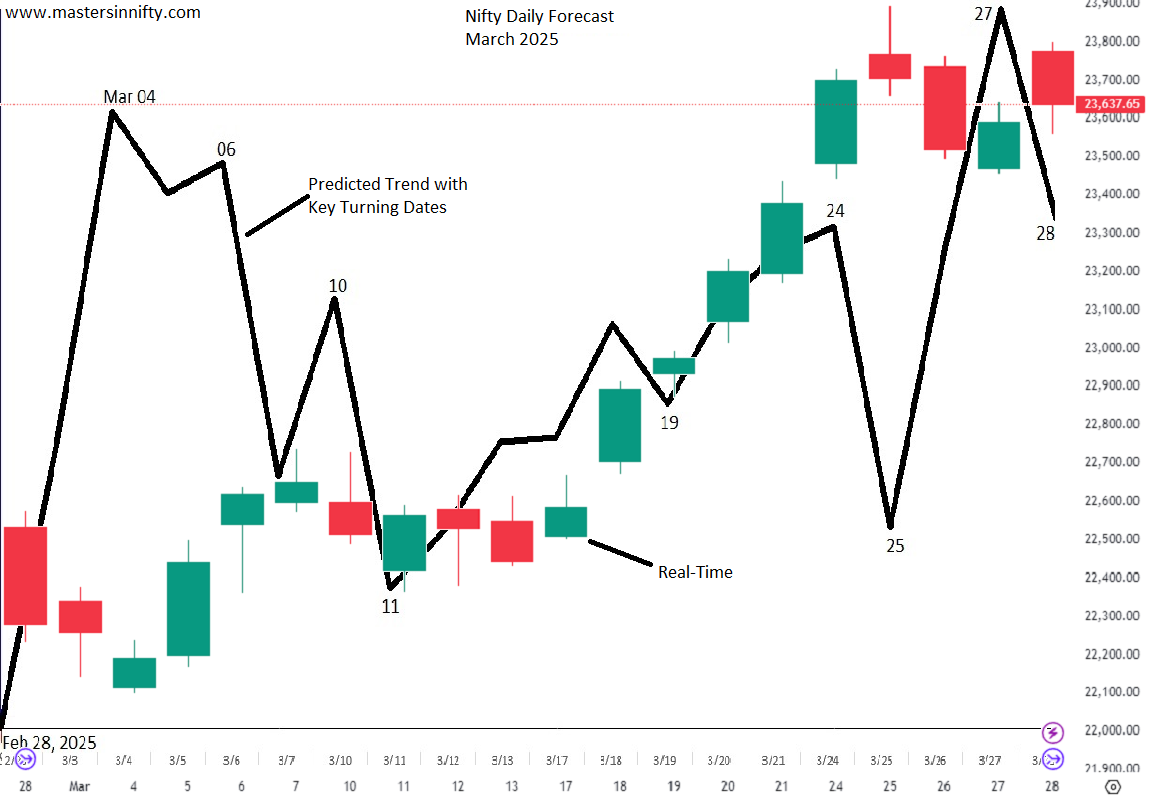
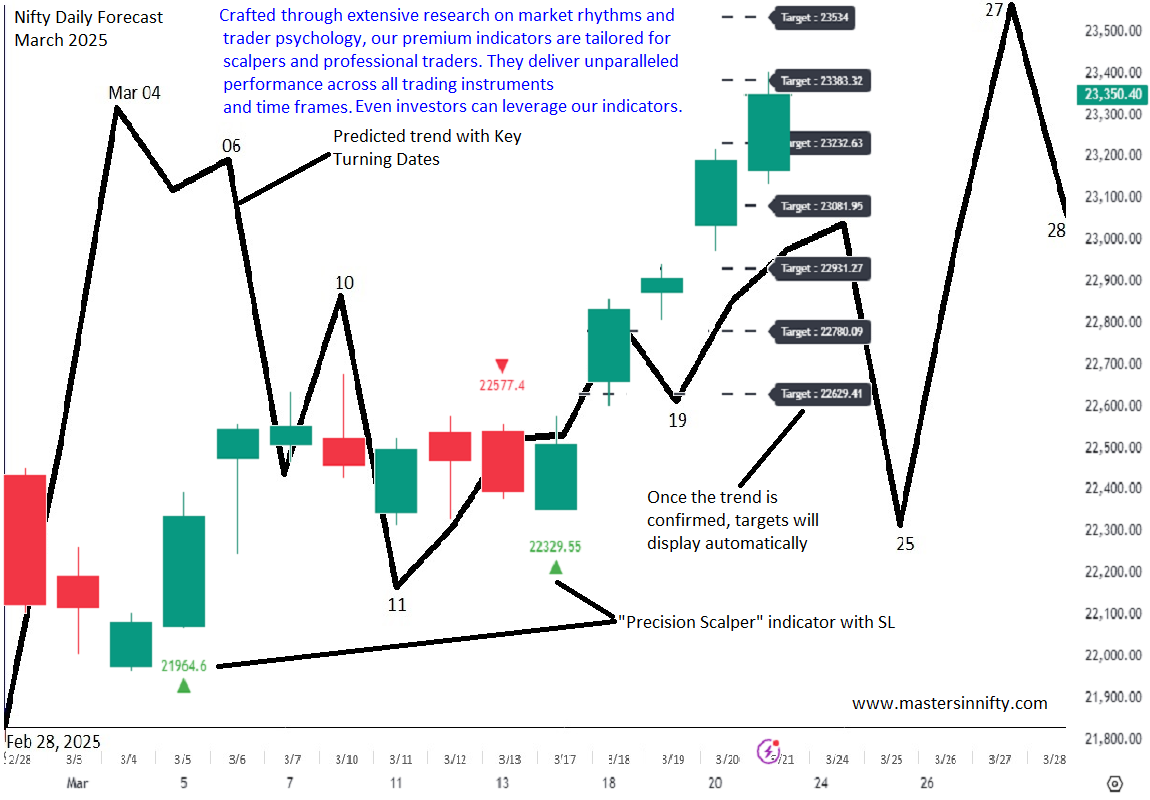
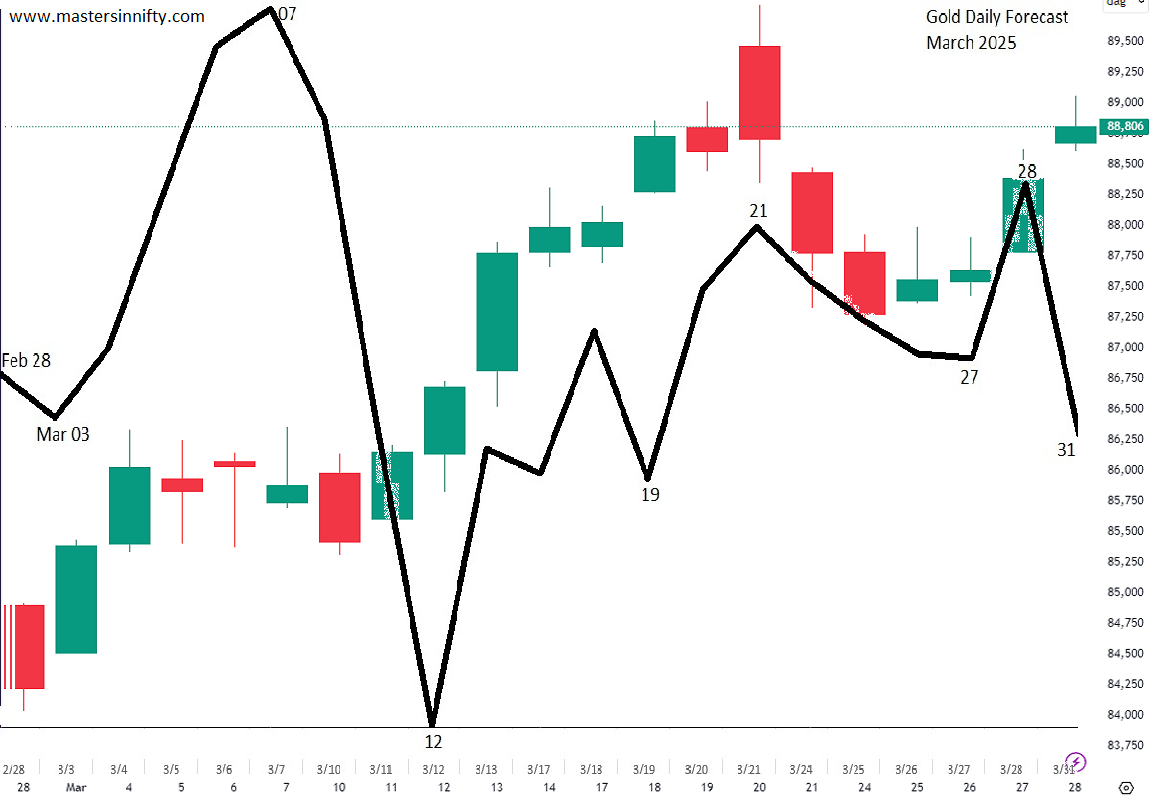
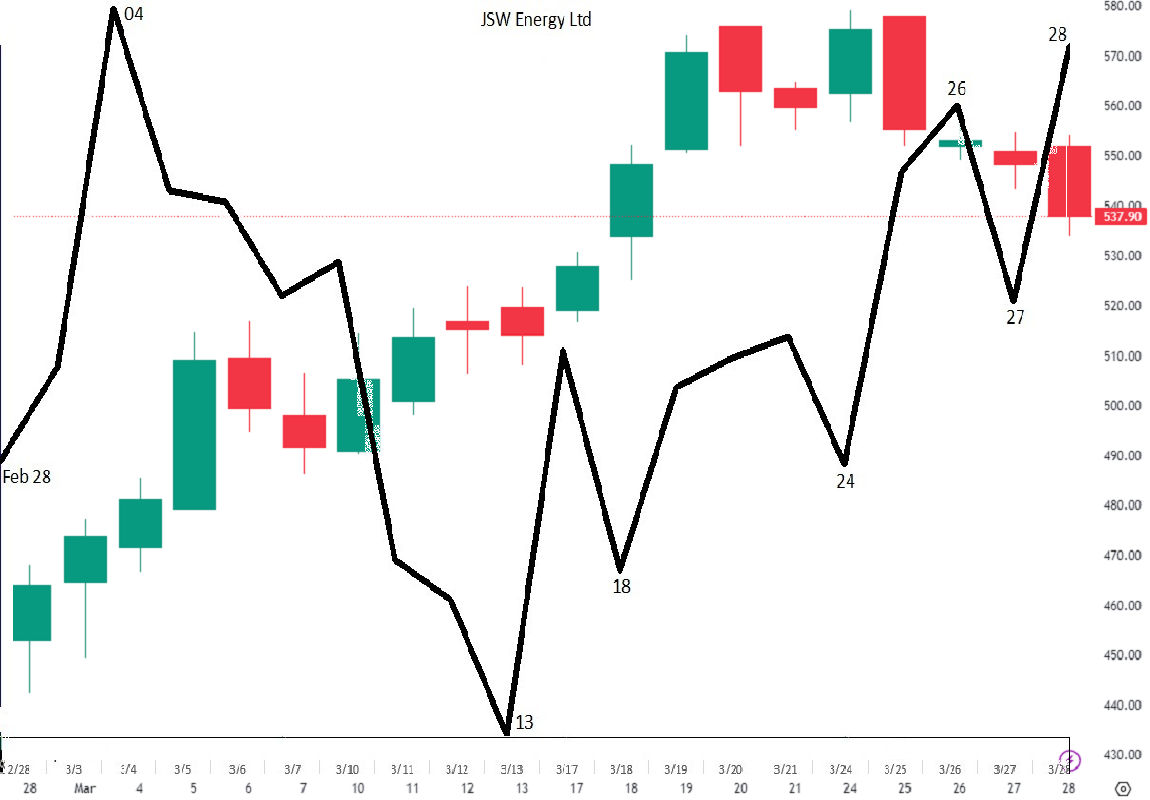
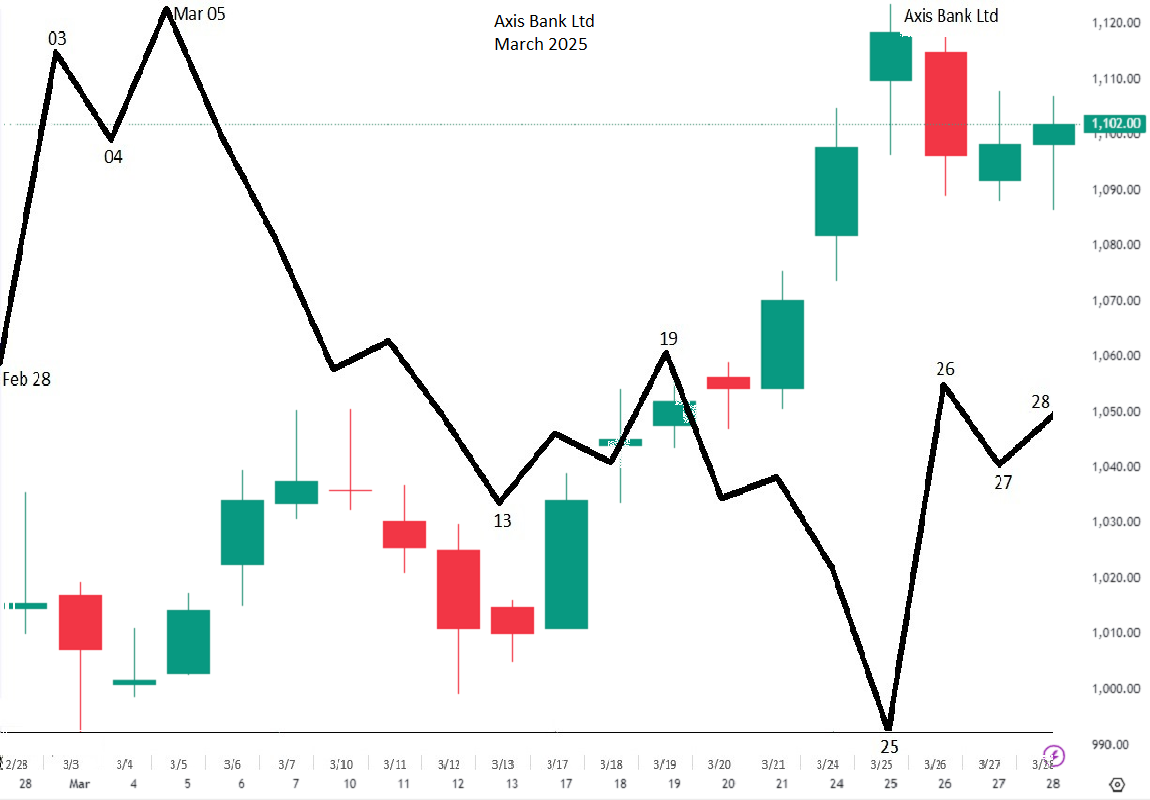
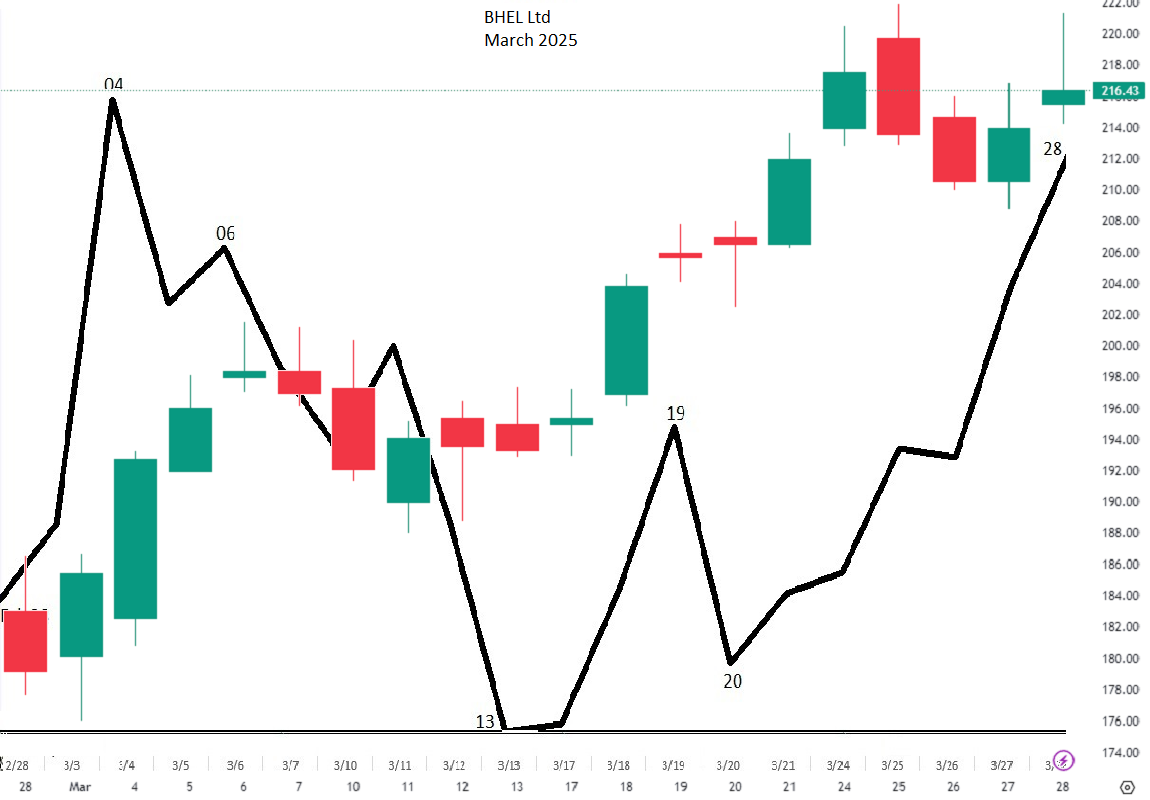
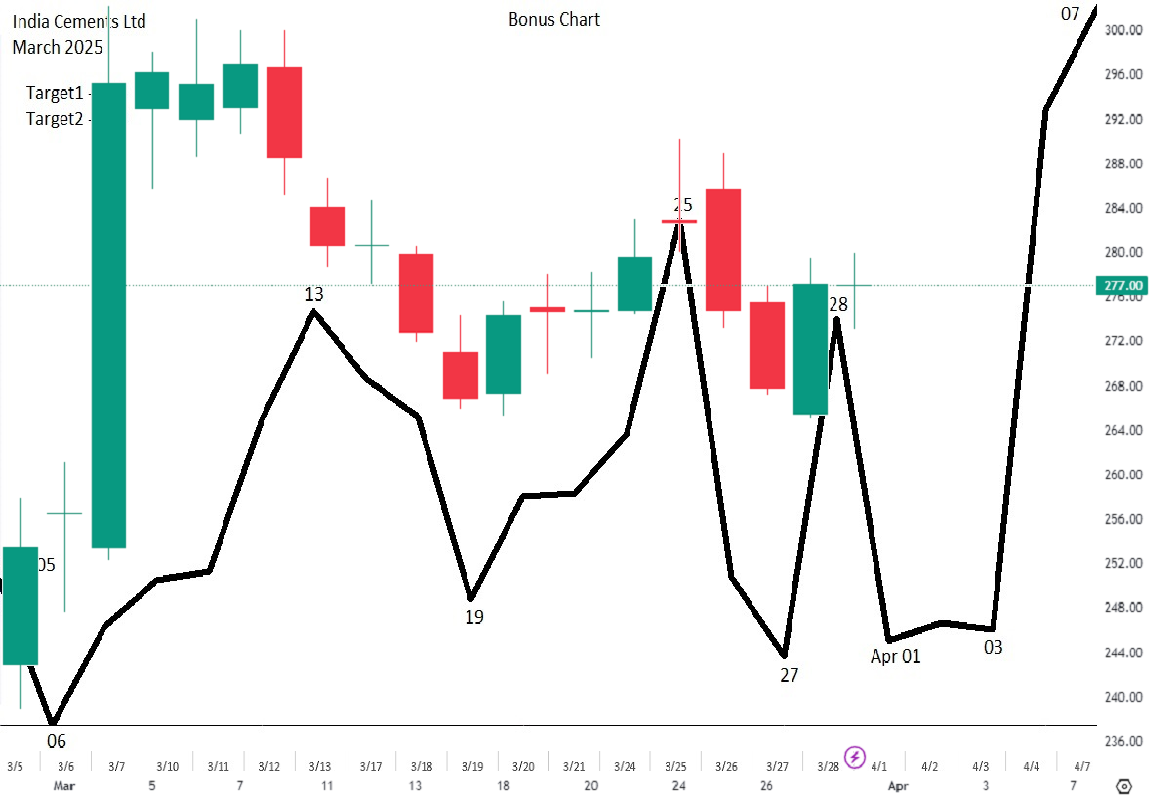
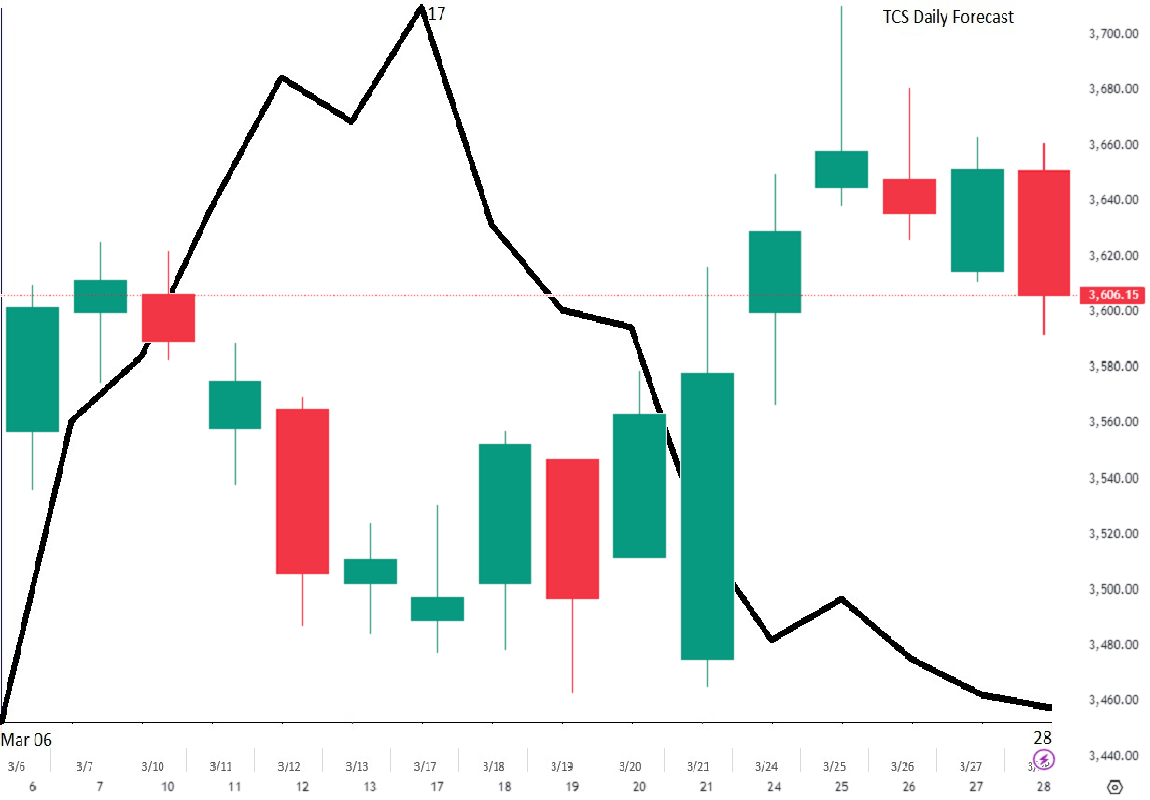
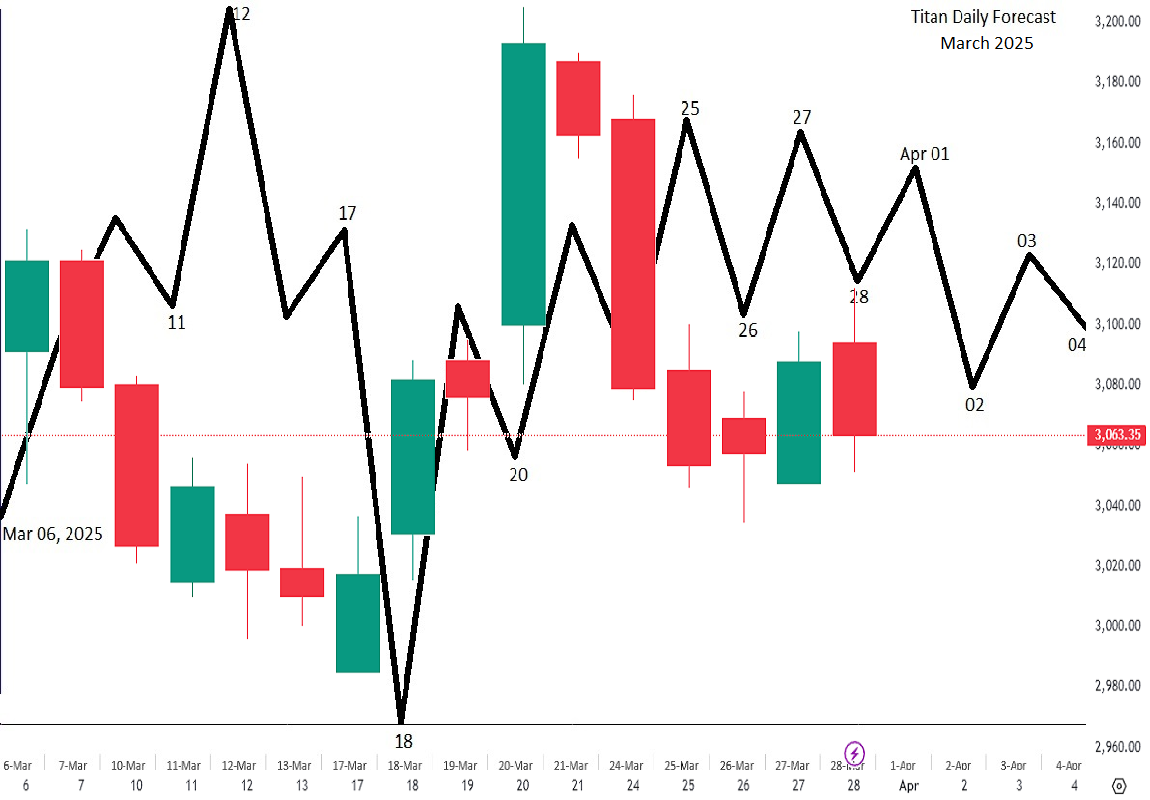
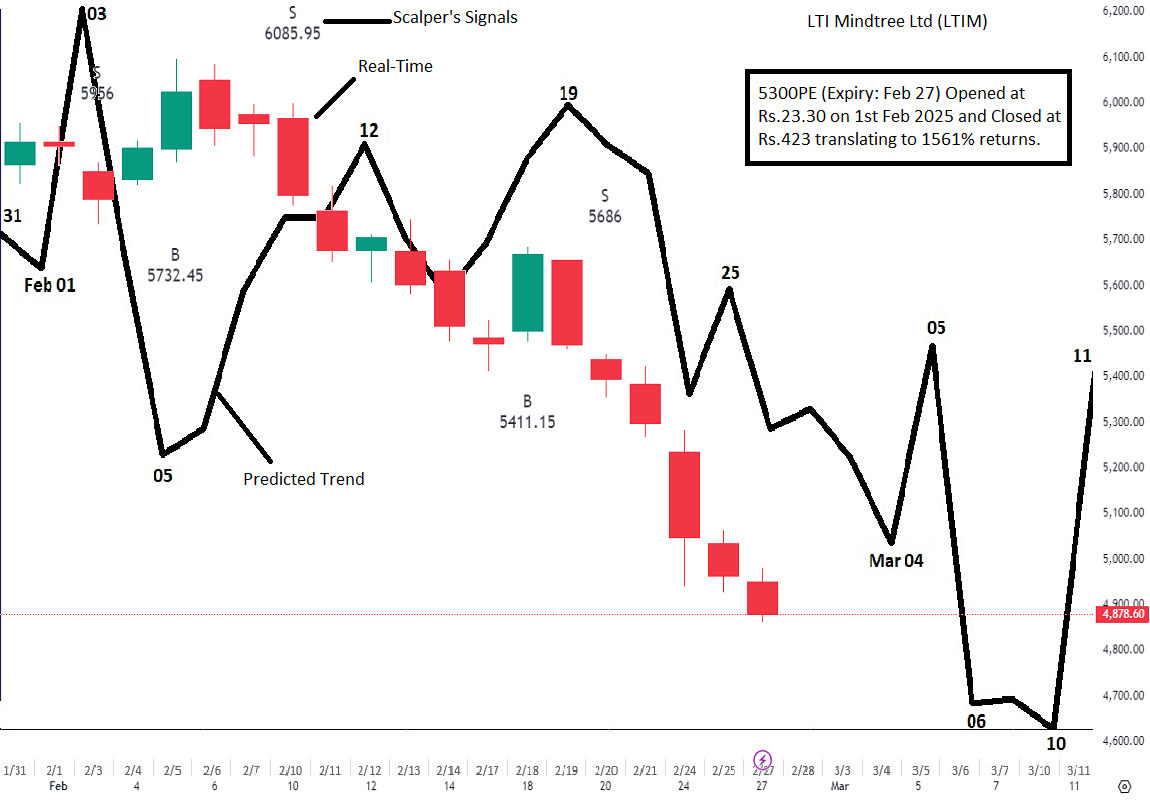
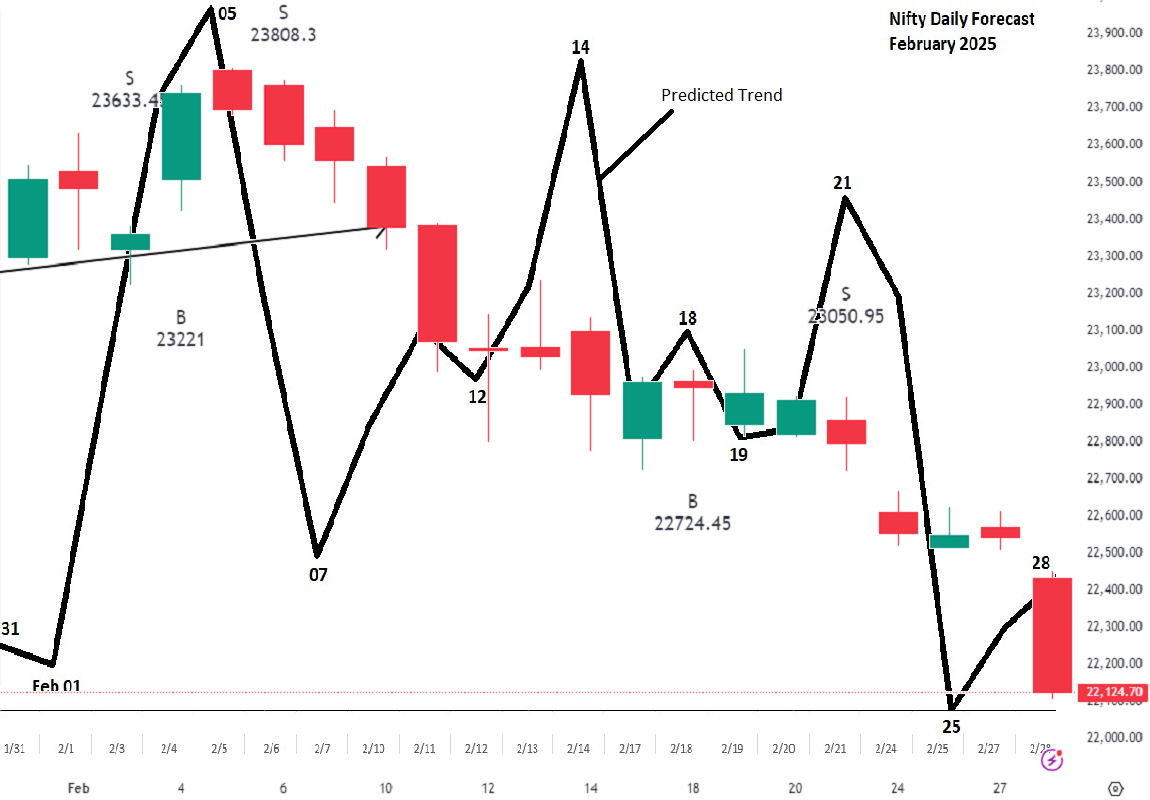
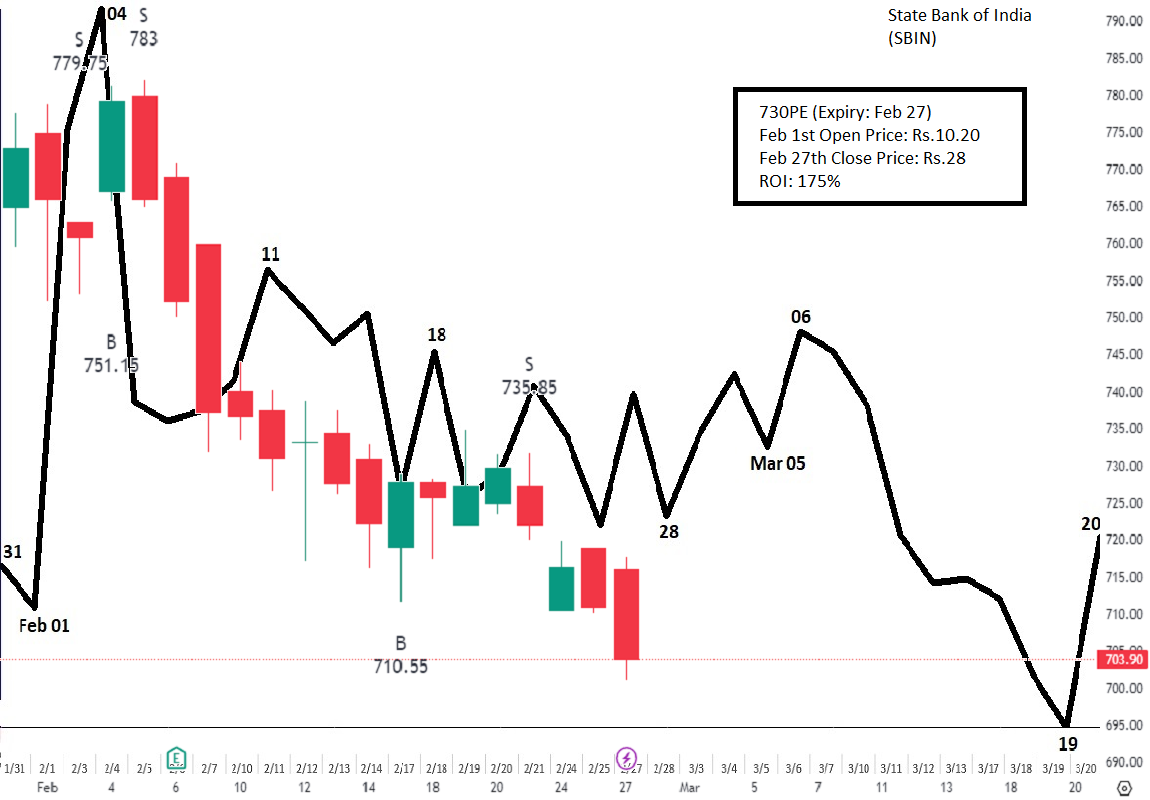
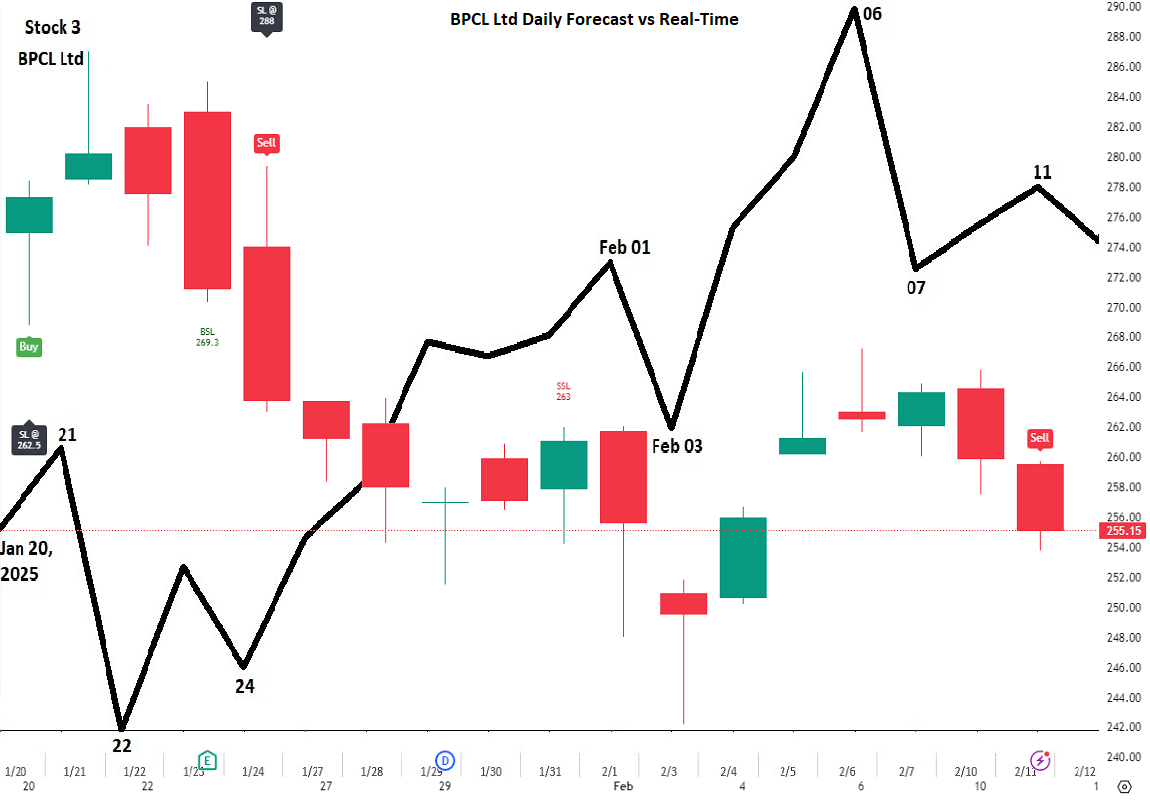
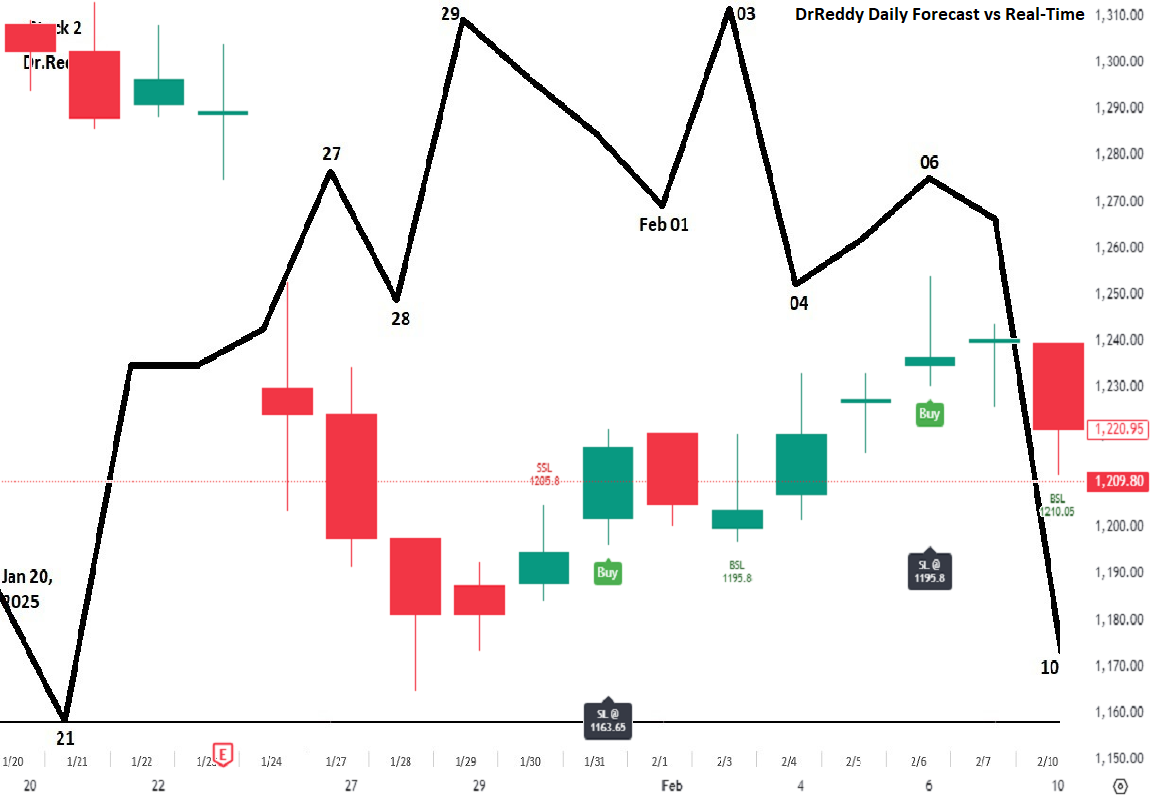
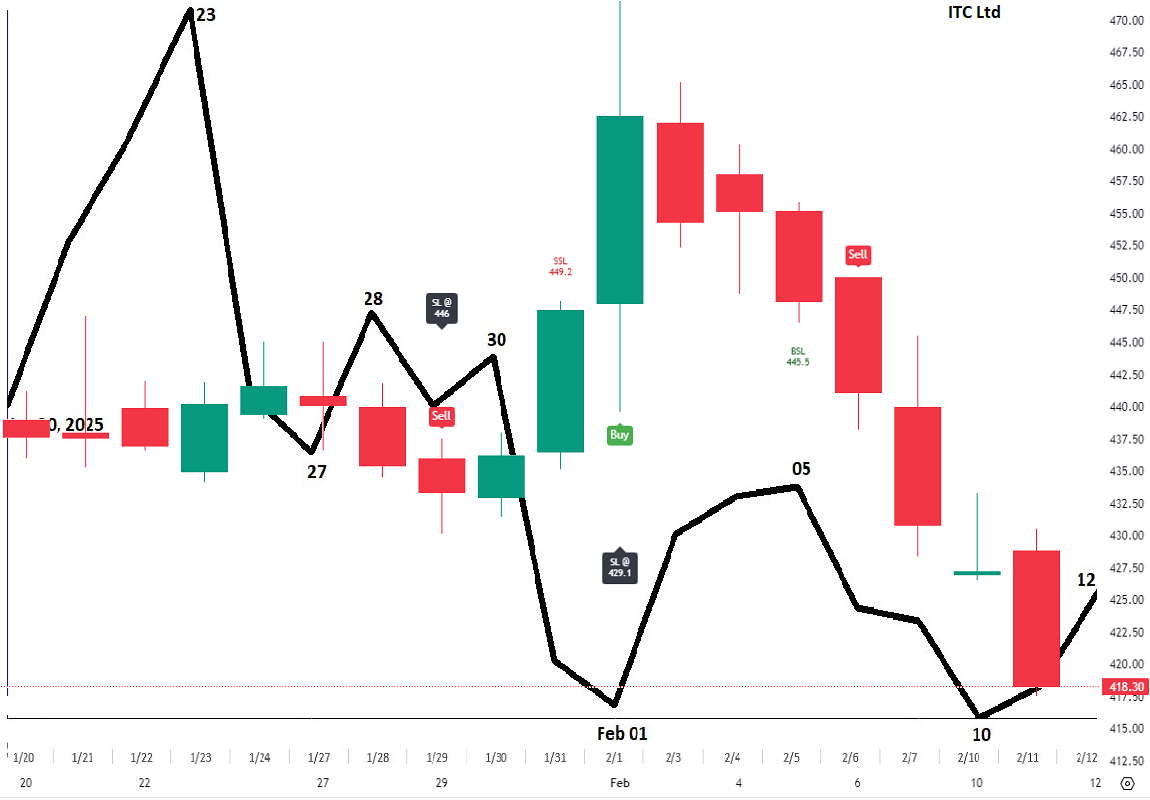
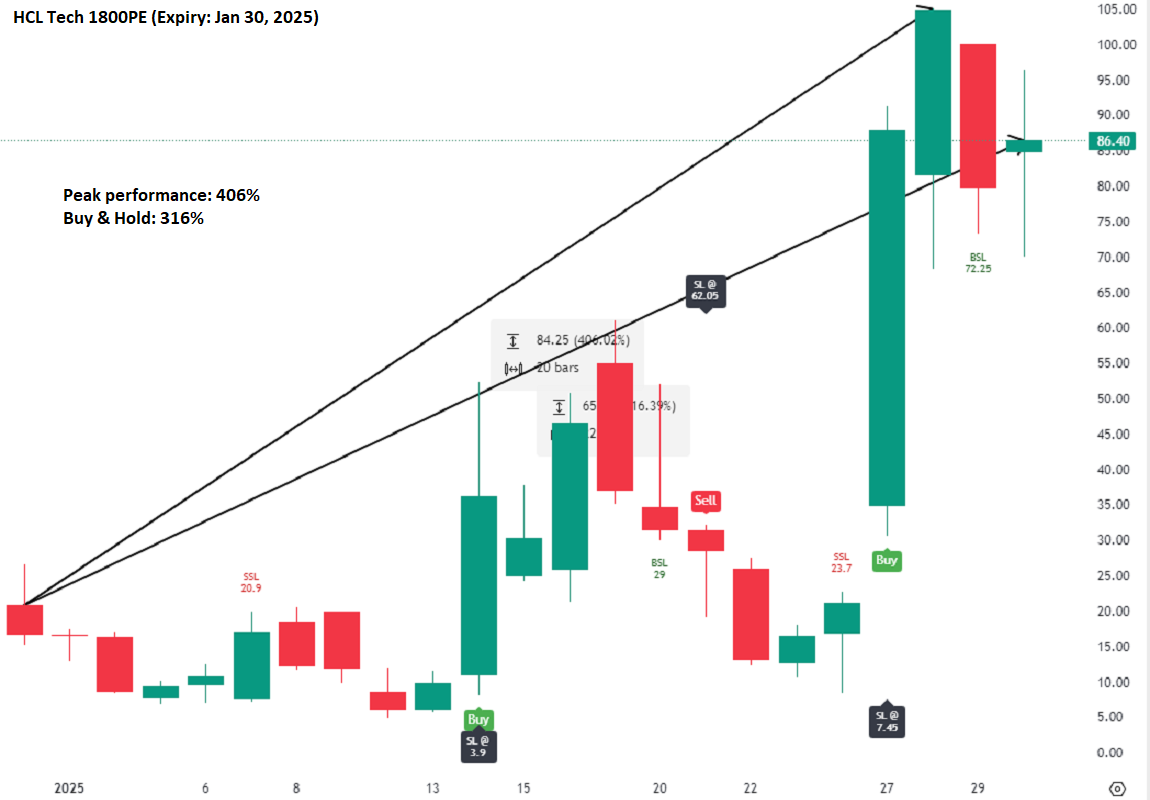
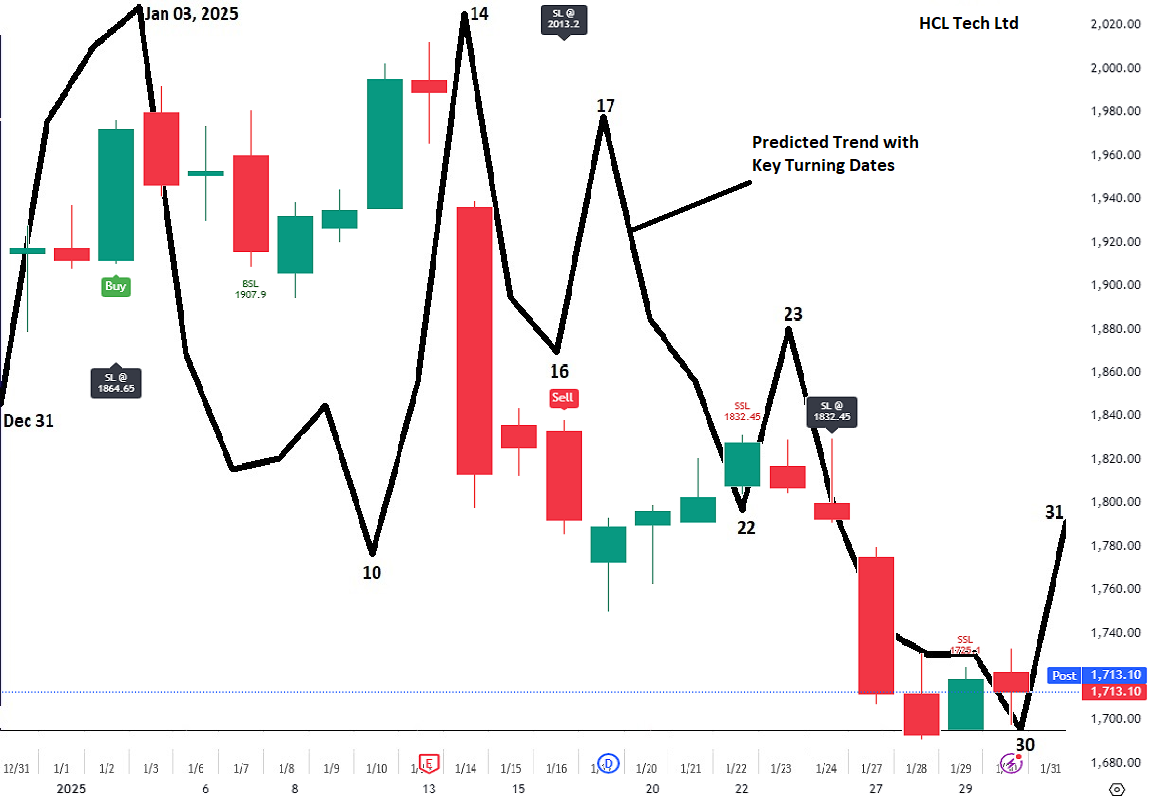
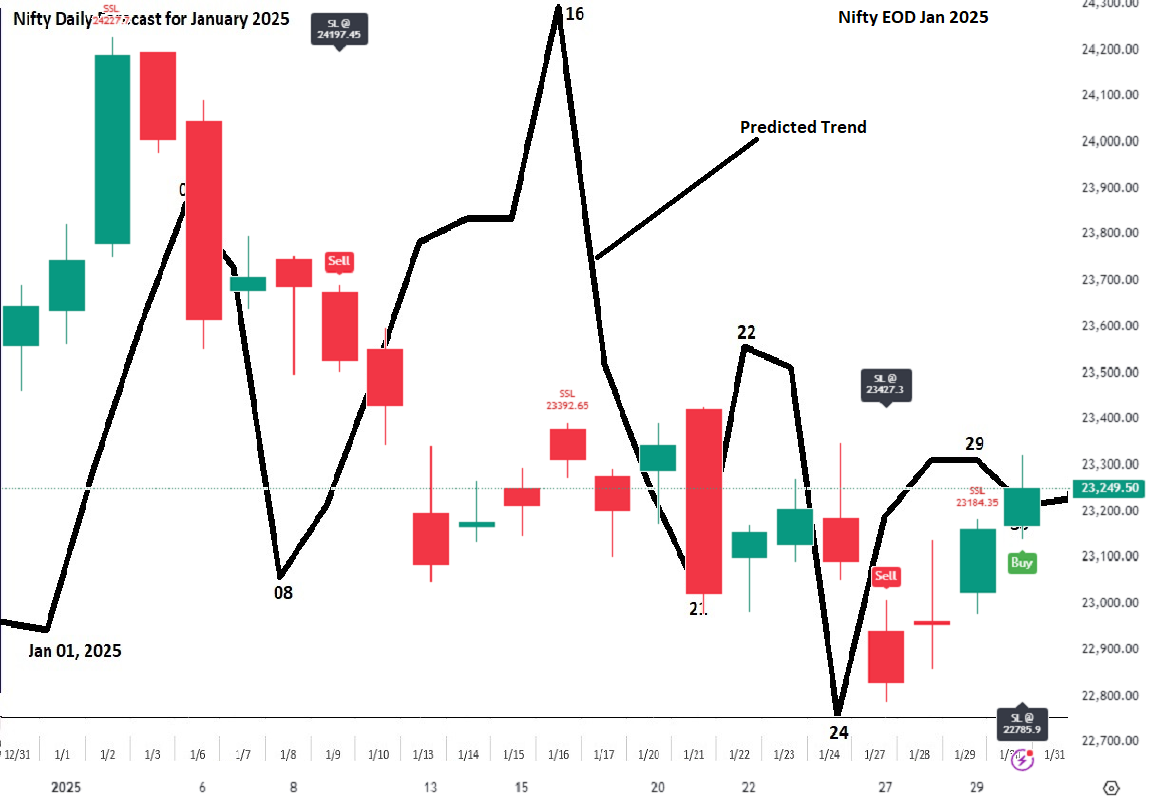
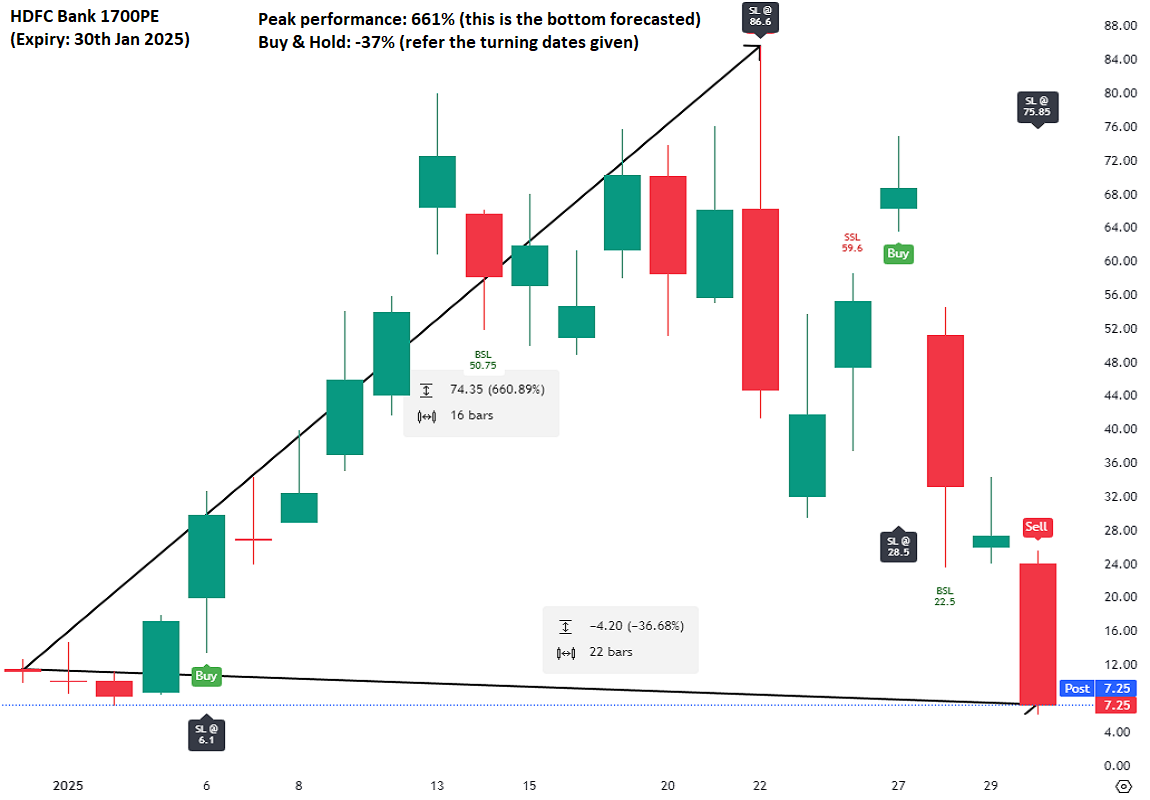
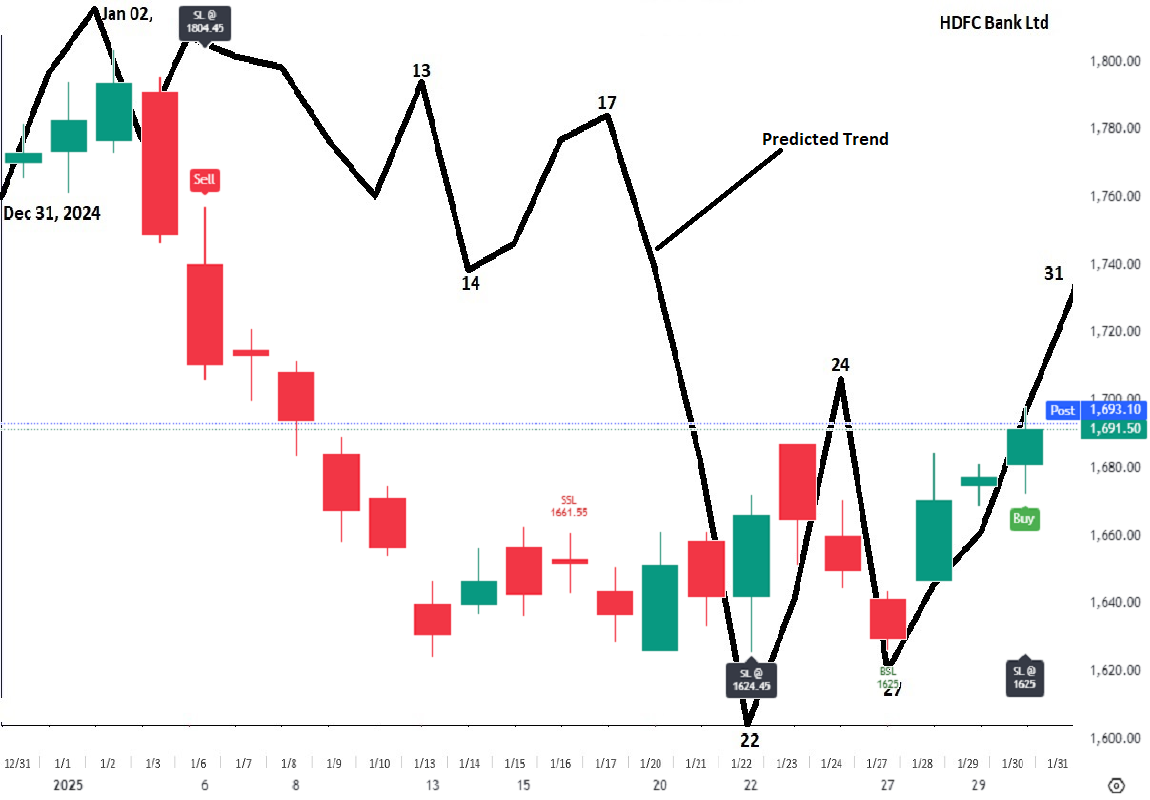
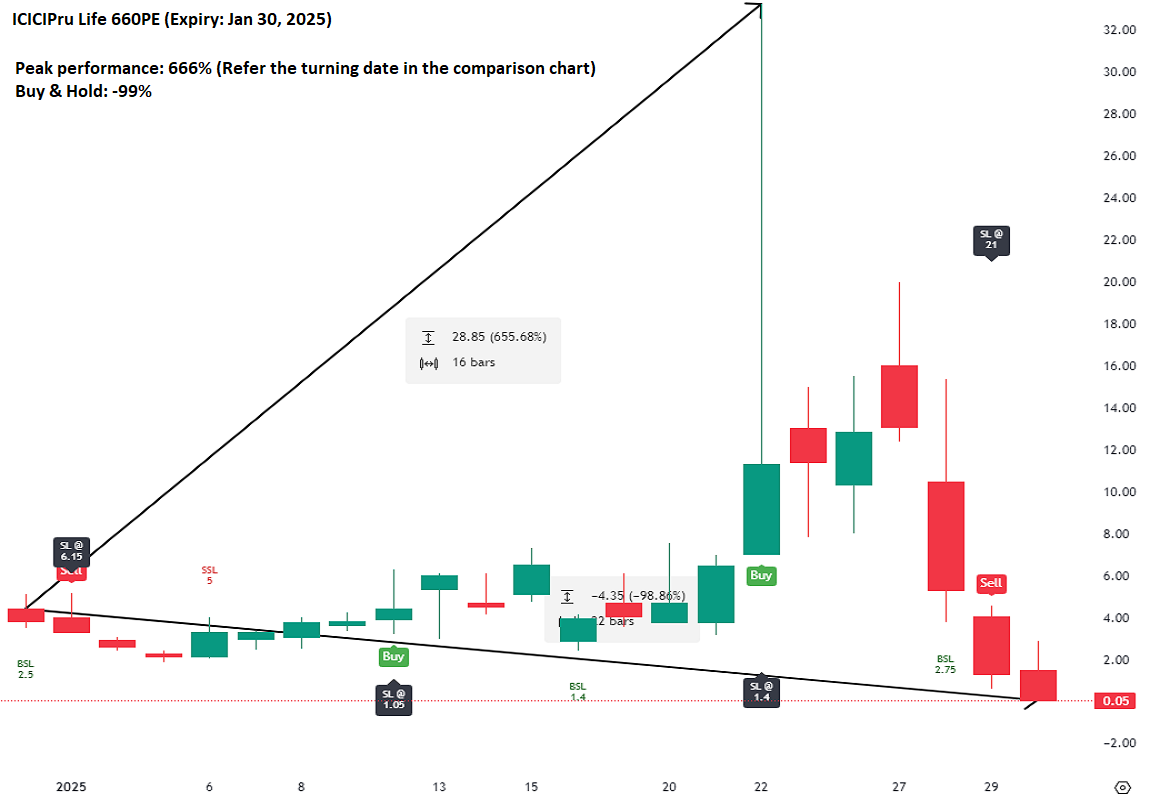
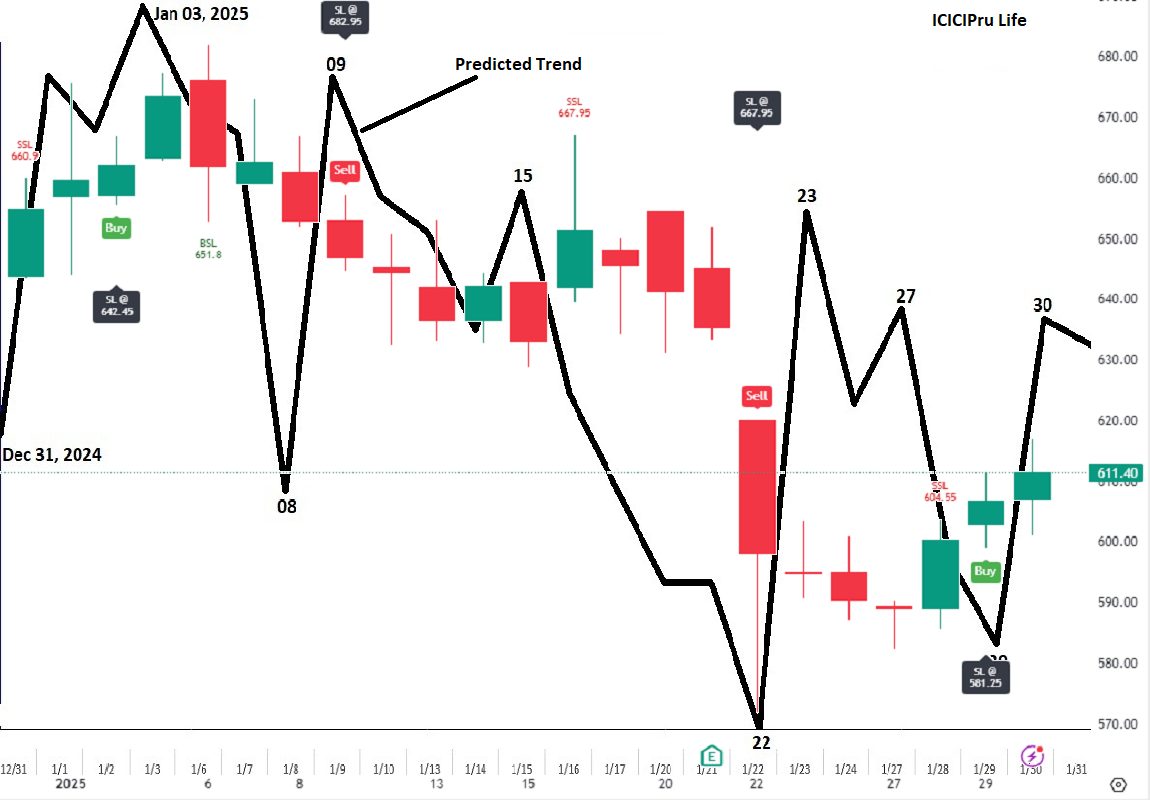
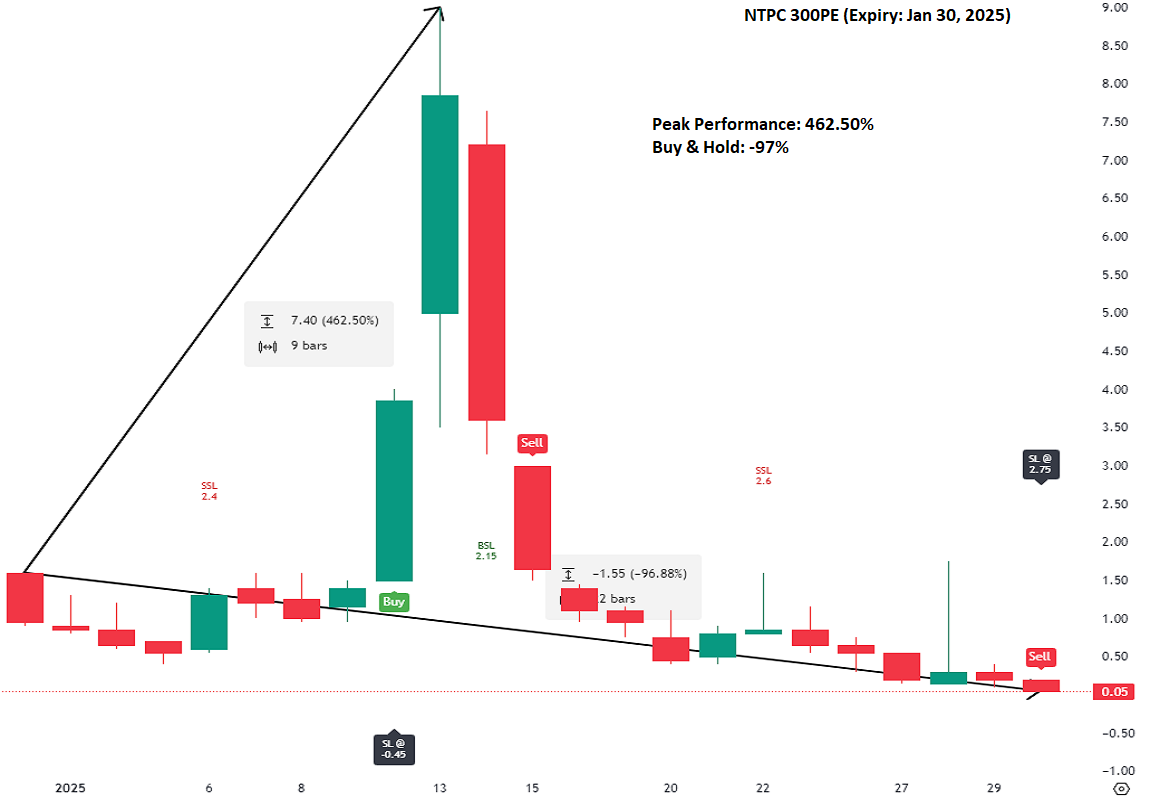
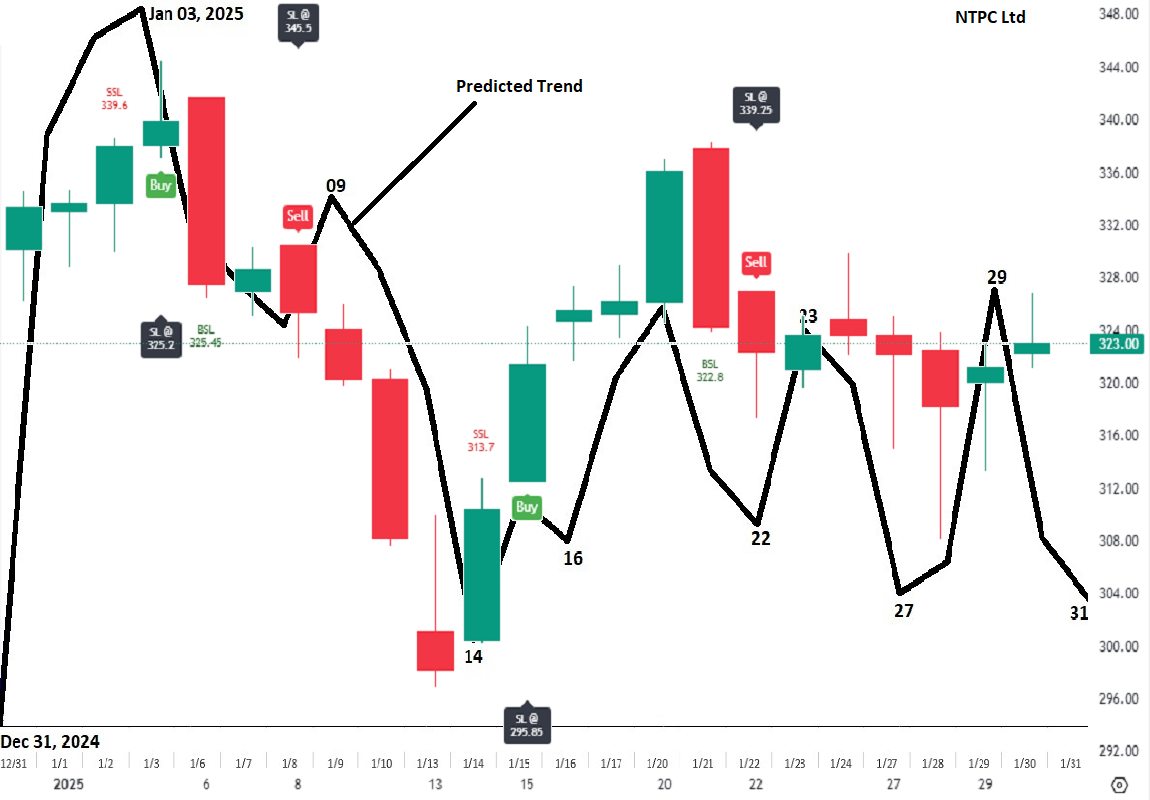
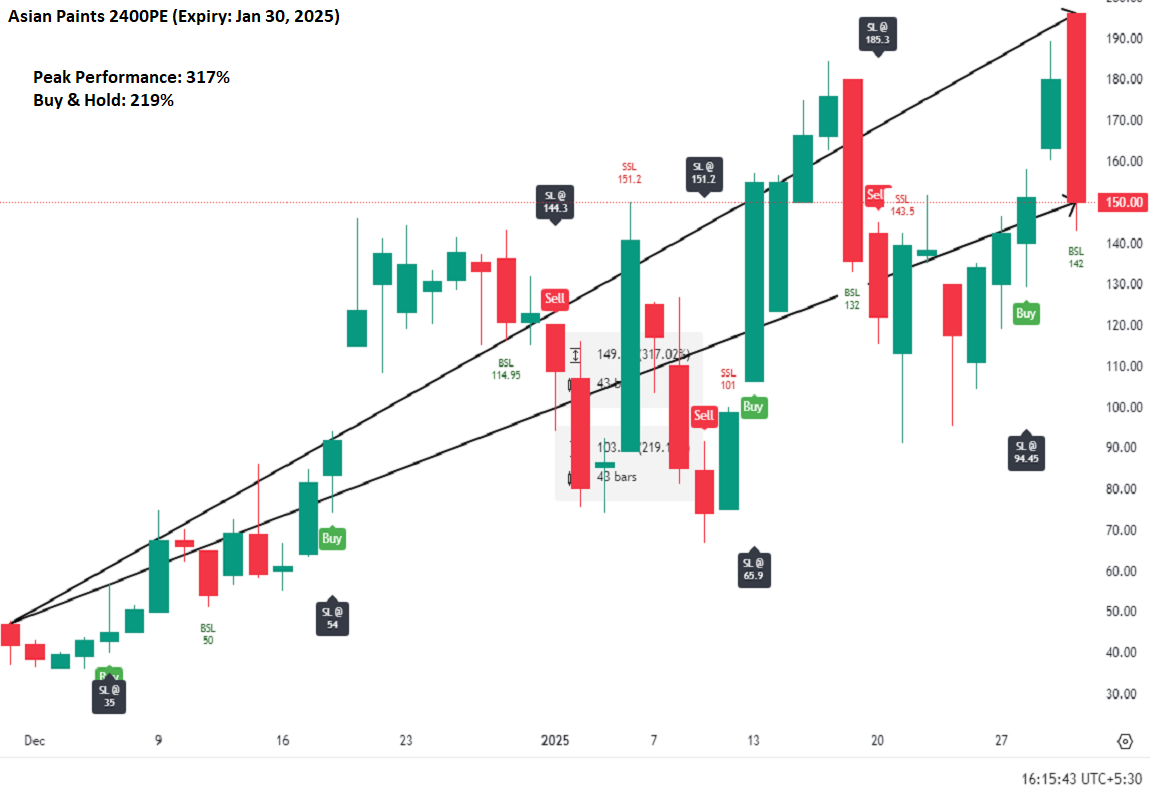
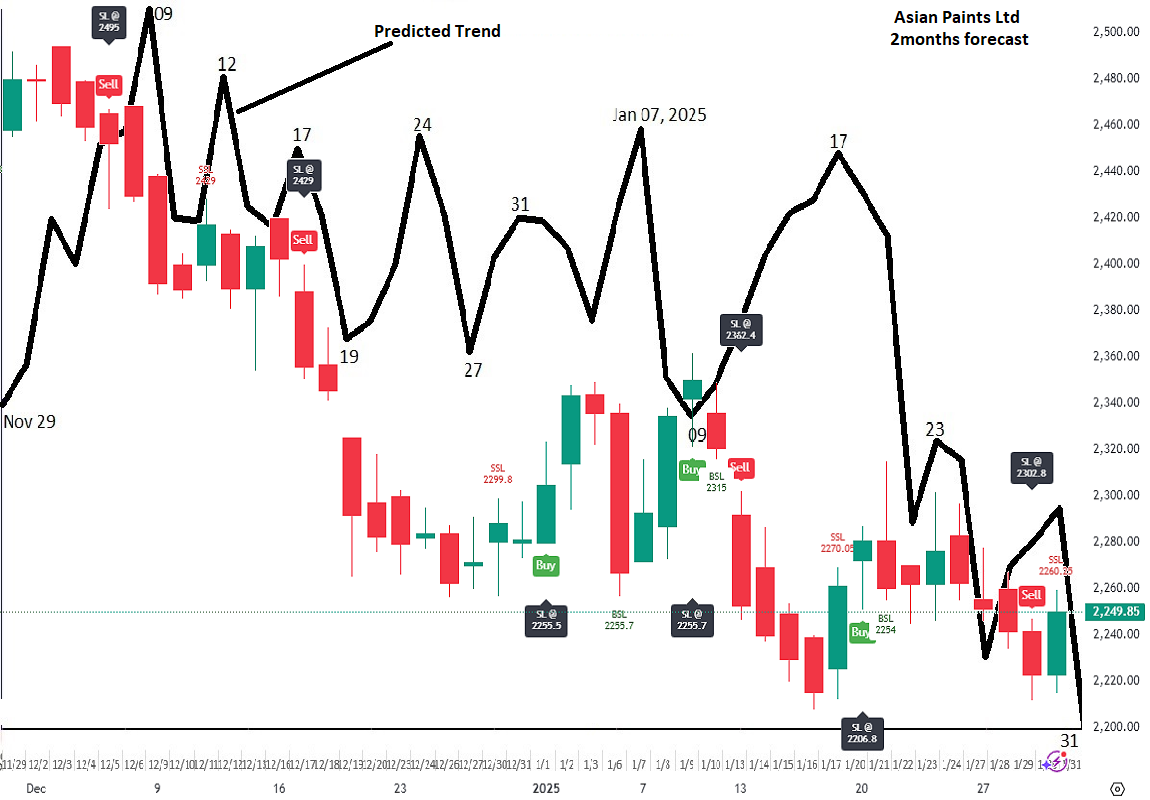
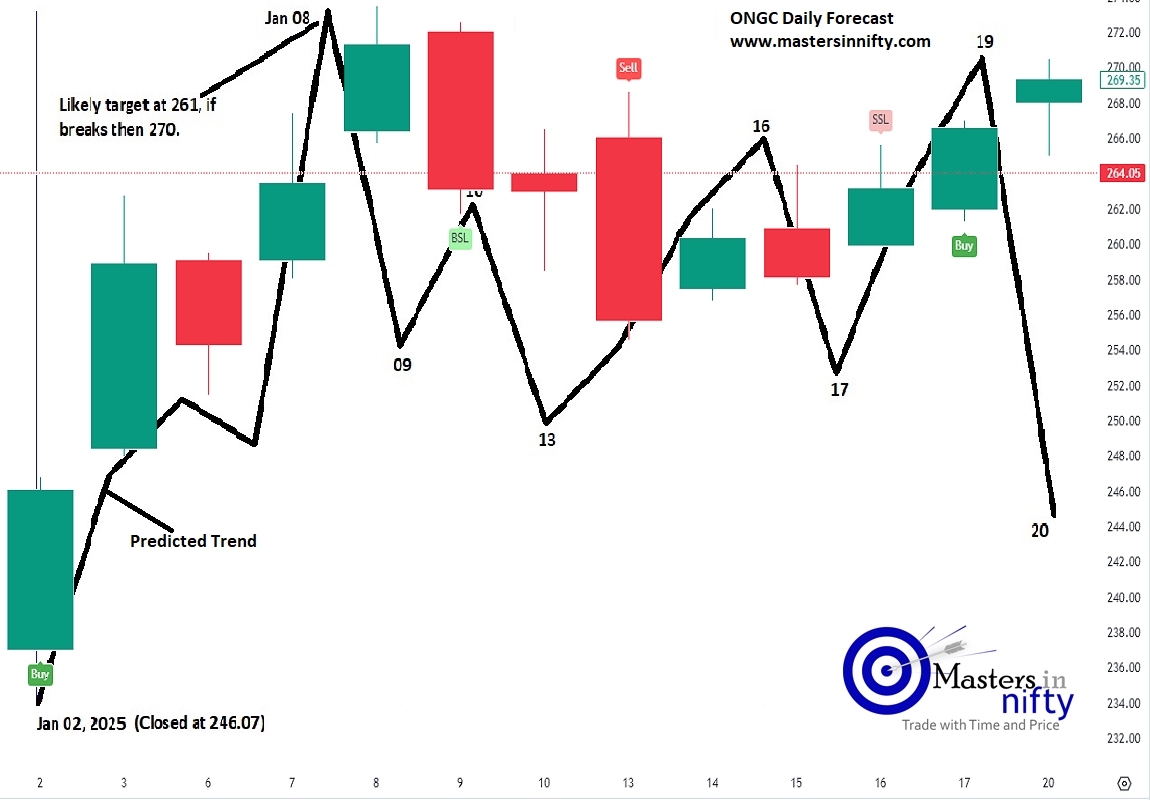
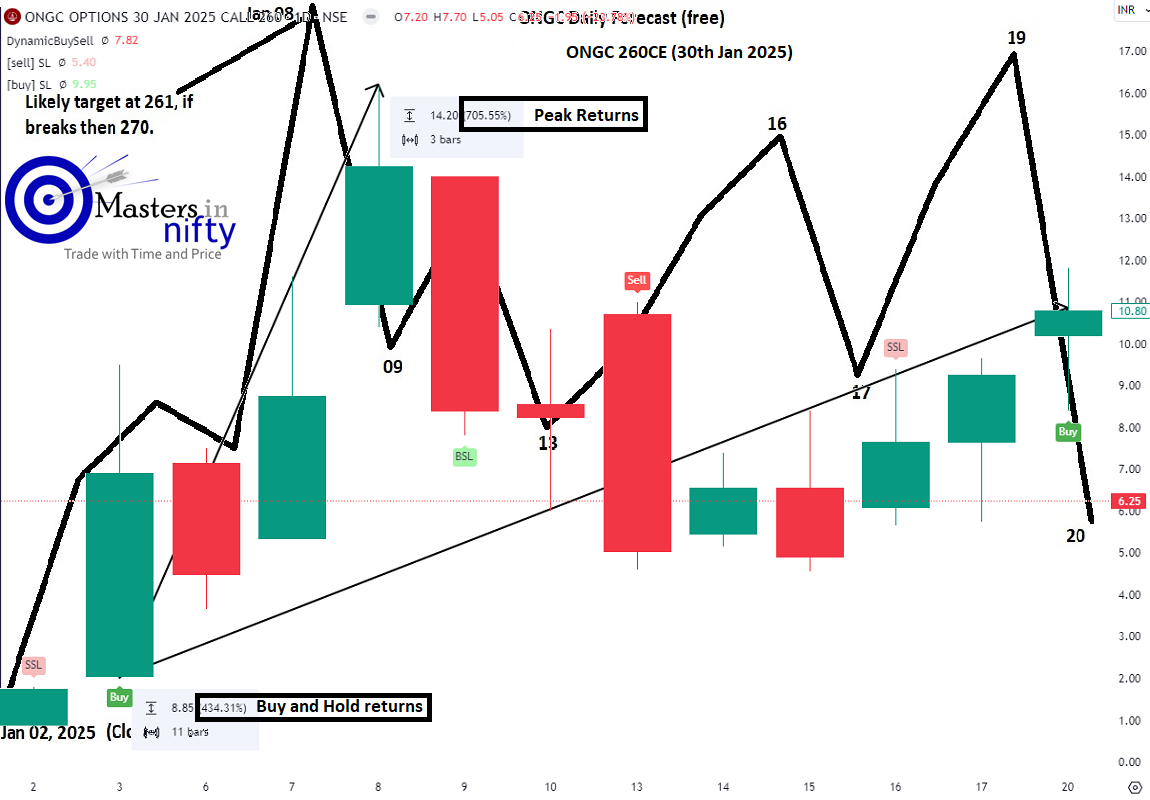
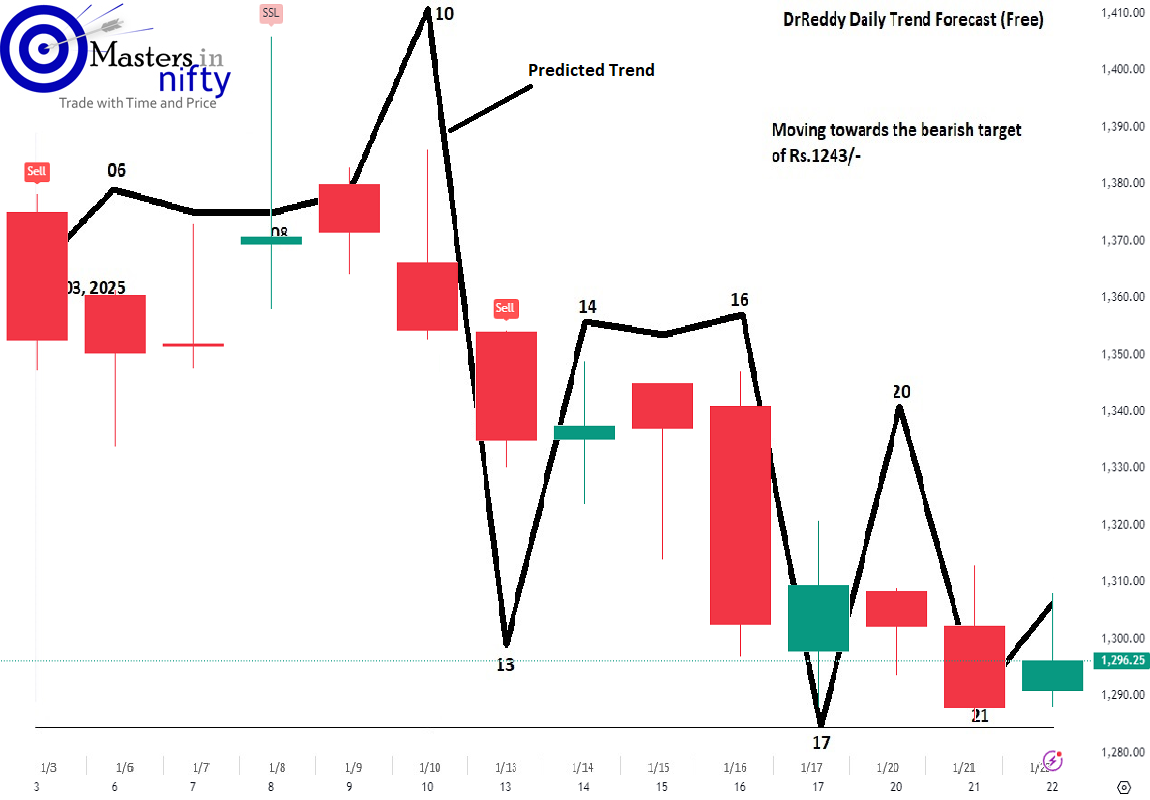
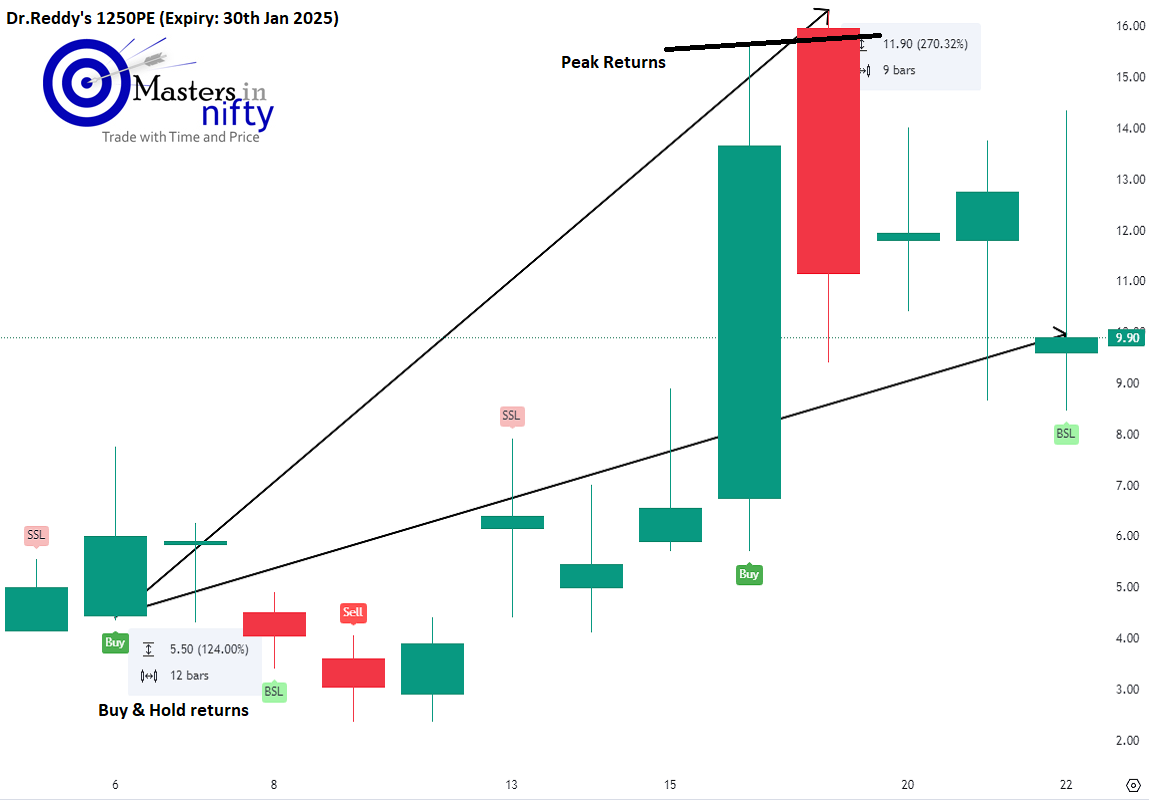
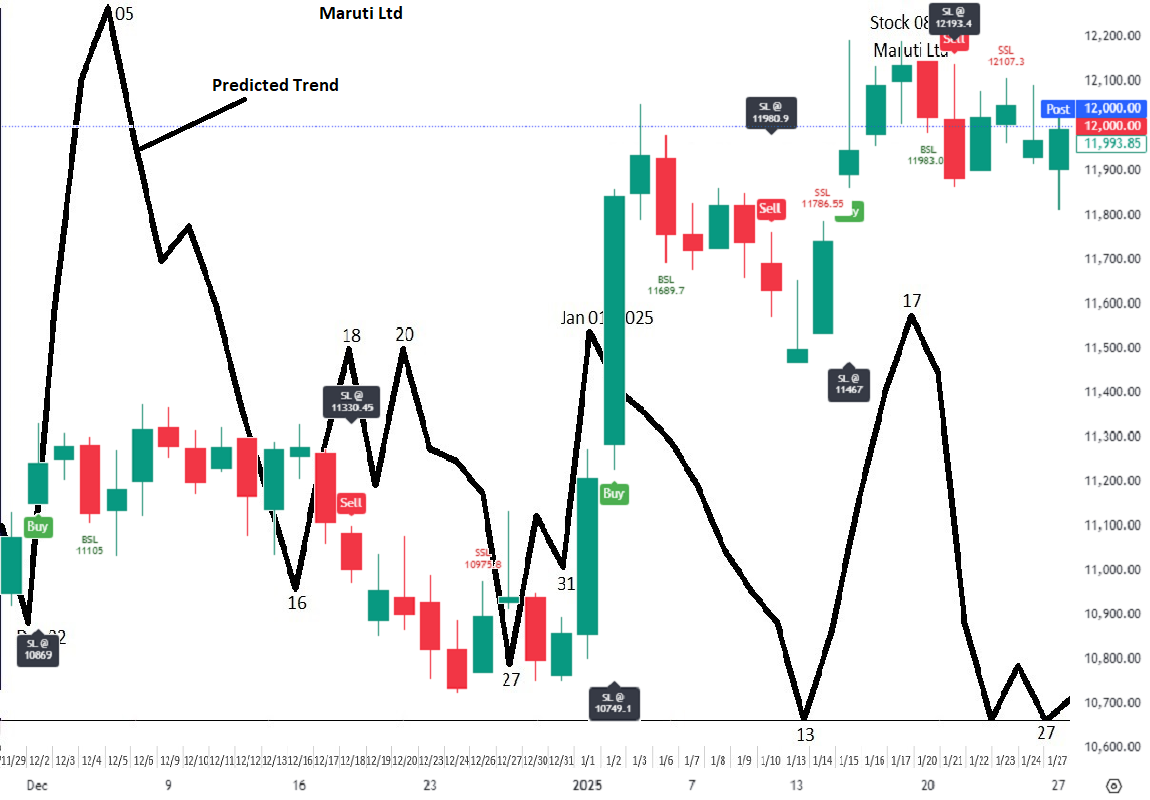
Our approach to market analysis surpasses conventional methods by incorporating advanced mathematical models to uncover intricate cycles and provide comprehensive forecasts for Nifty or individual stocks, enabling traders to make informed decisions with a broader perspective on market trends and movements. Here are the End of Day forecast chart comparisons to understand better.

Want to take a look at our intraday forecast performance? Click here

or, BTST/STBT forecast performance? Click here

April 2025 - Daily Forecast chart comparisons

  • 01 Nifty.jpg

March 2025 - Daily Forecast chart comparisons

  • 01 Unitedspirits.png
  • 1.png
  • 001n.png
  • 001nrt.png
  • 002 Gold.png
  • 02 JSWEnergy.png
  • 03 Axis.png
  • 04 BHEL.png
  • 05 Indiacem.png
  • 06 IOC.png
  • 07 TCS.png
  • 07 Titan.png

2025 February - EOD Stocks comparisons

  • 01LTIM fvr.png
  • 001nifty fvr.png
  • 02SBIN fvr.png
  • 03 TCS rt.png
  • 21 BPCL.png
  • 21 BPCL290ce.png
  • 21 Drreddy.png
  • 21 Drreddy1400ce.png
  • 21 ITC.png
  • 21 ITC440ce.png

January 2025 - Daily Forecast chart comparisons

  • 01ahcltech.png
  • 01hcltech.png
  • 001nifty.png
  • 02ahdfcbank.png
  • 02hdfcbank.png
  • 03aicicipru.png
  • 03icicipru.png
  • 04antpc.png
  • 04ntpc.png
  • 05aasianpaints.png
  • 05asianpaints.png
  • 05ongc.png
  • 05ongc260ce.png
  • 06drreddy.png
  • 06drreddy1250pe.png
  • 06maruti.png