To open your TradingView account: Click here
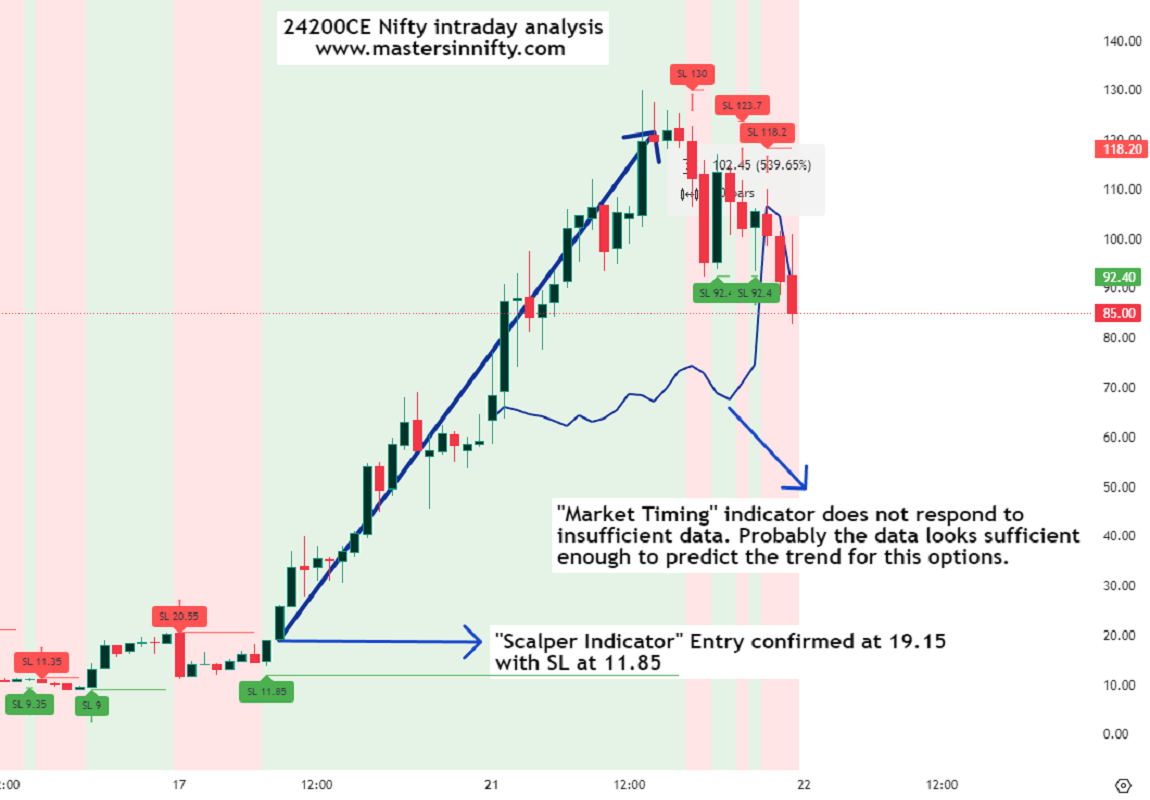
1. Indicator Name: Market Timing (Mastersinnifty)
Overview:
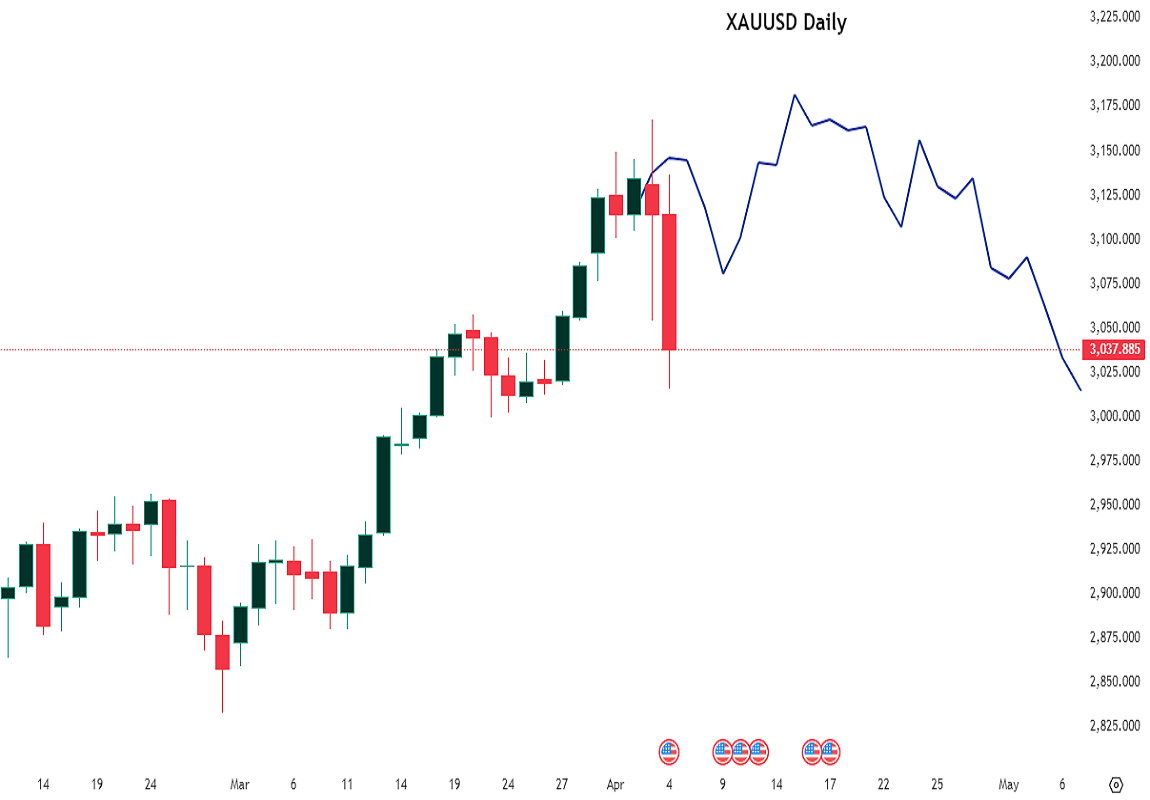
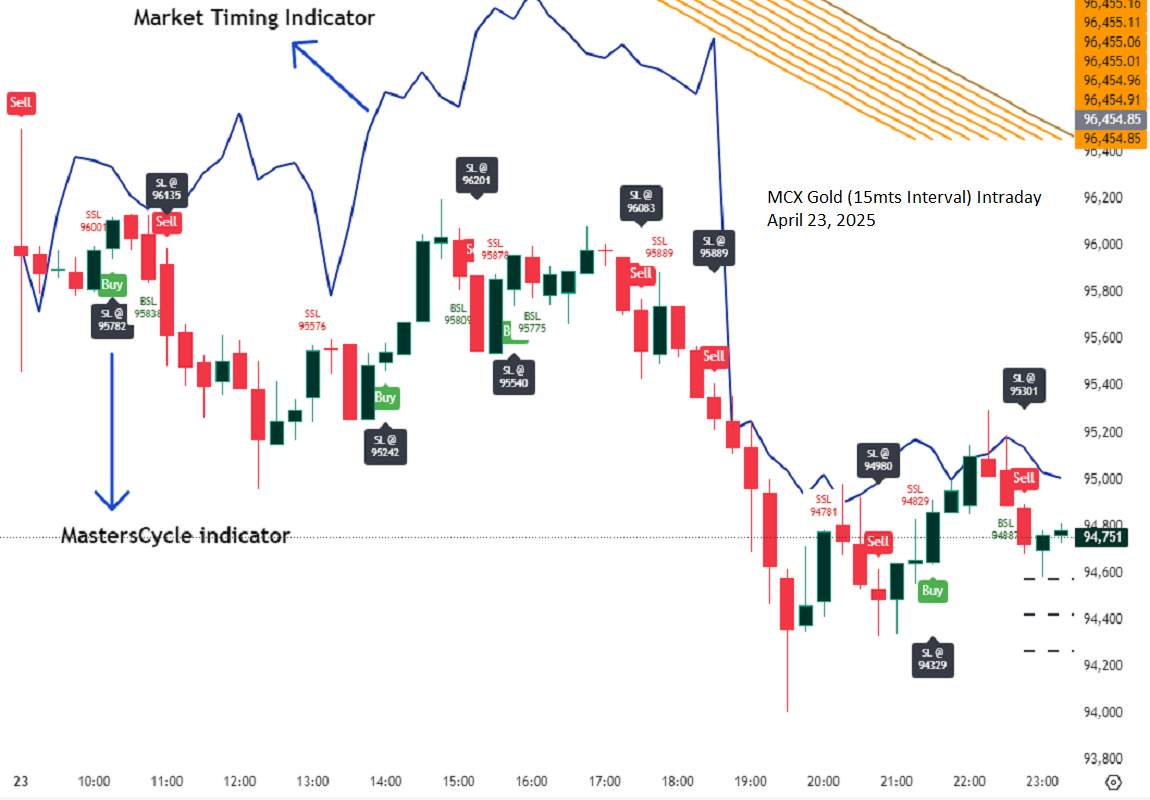
Market Timing (Mastersinnifty) is a proprietary visualization tool designed to help traders study historical market behavior through structural pattern similarity.
The script analyzes the most recent session’s price action and identifies the closest-matching historical sequence among thousands of past patterns. Once a match is found, the script projects the subsequent historical price path onto the current chart for easy visual reference.
Unlike traditional indicators, Market Timing (Mastersinnifty) does not generate trade signals. Instead, it offers a unique historical scenario analysis based on quantified structural similarity.
═════════════════════════════════════════════════════════════
Key Features:
- Historical Pattern Matching: Quantitative matching of the most similar past price structure.
- Dynamic Projections: Visualizes likely historical scenarios based on past market behavior.
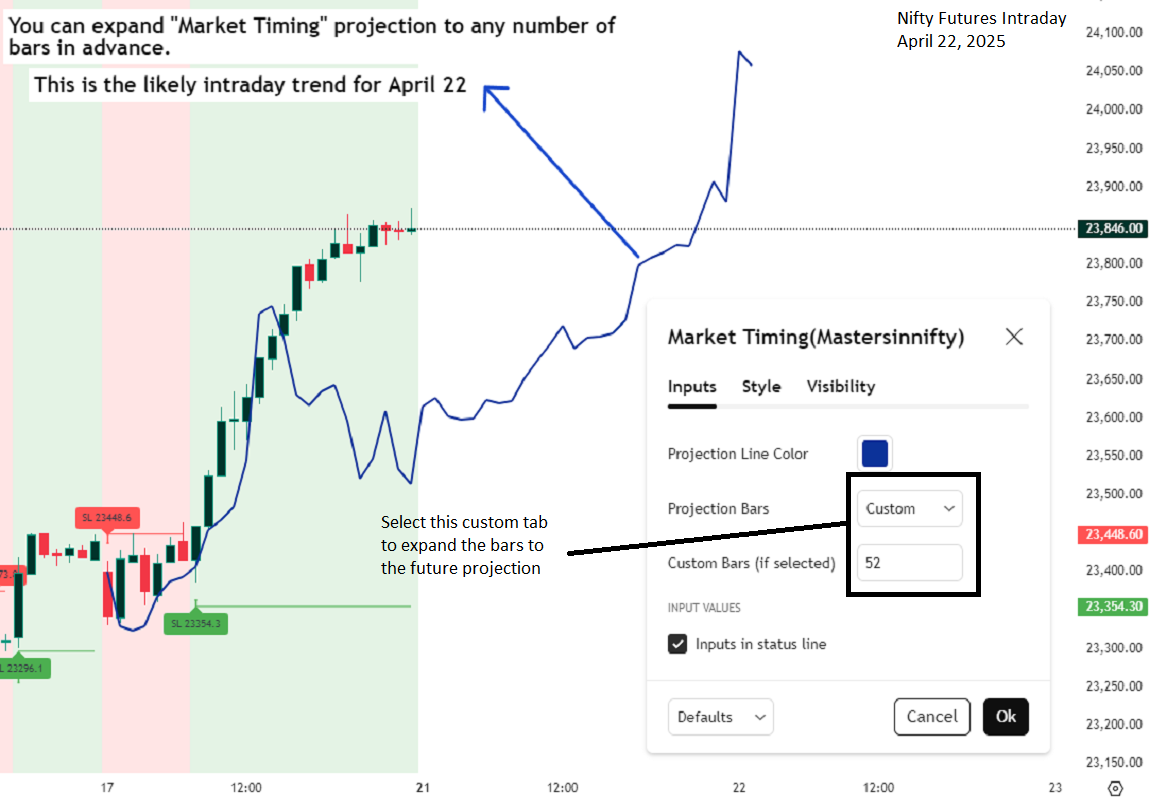
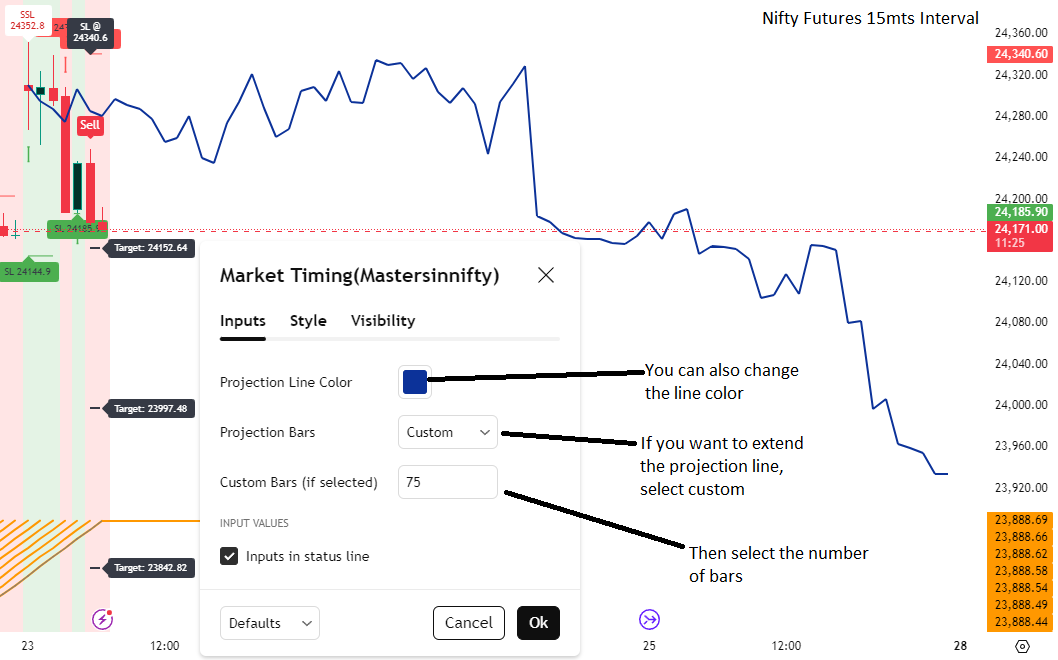
- Auto/Manual Projection Length: Flexible control over the number of projected bars.
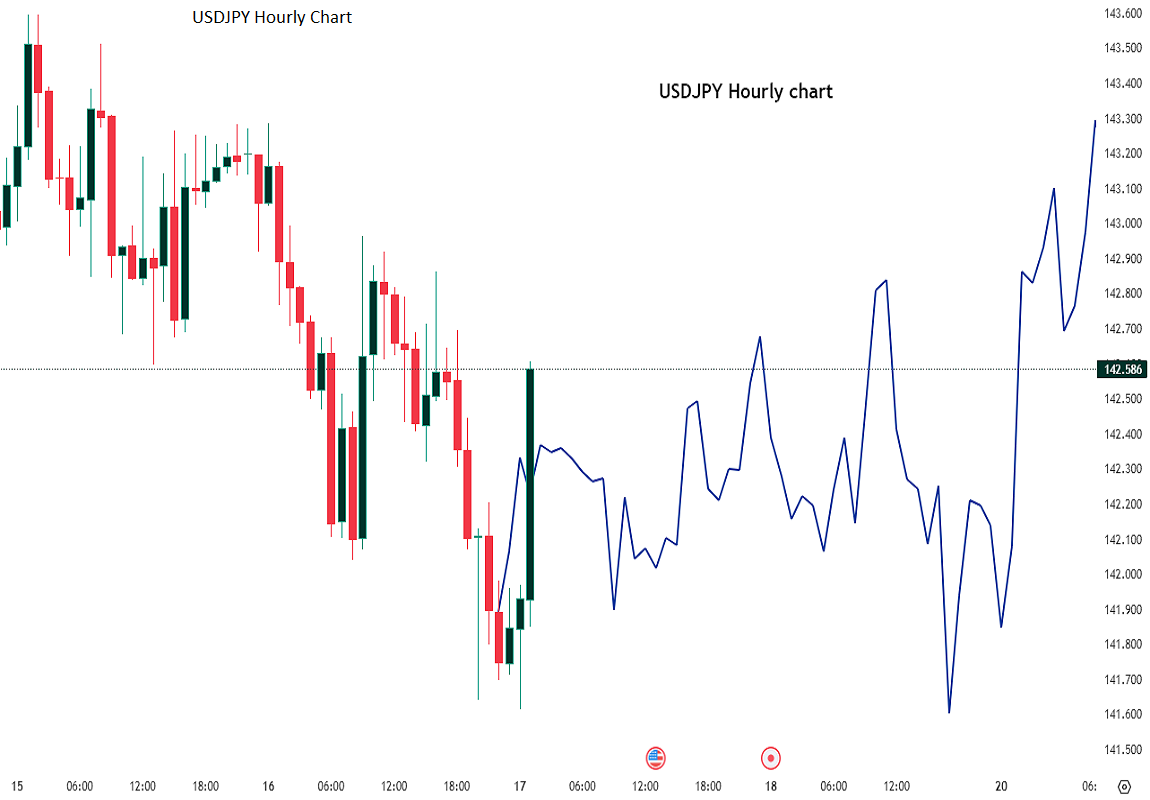
- Multi-Timeframe Support: Works seamlessly across intraday, daily, weekly, and monthly charts.
- Purely Visual Context: Designed to support human decision-making without replacing it with automatic trade signals.
How it works:
- The script captures the last 20 closing prices and compares them to historical price sequences from the past 8000 bars.
- Similarity is computed using the Euclidean distance formula (sum of squared differences) between the current pattern and historical candidates.
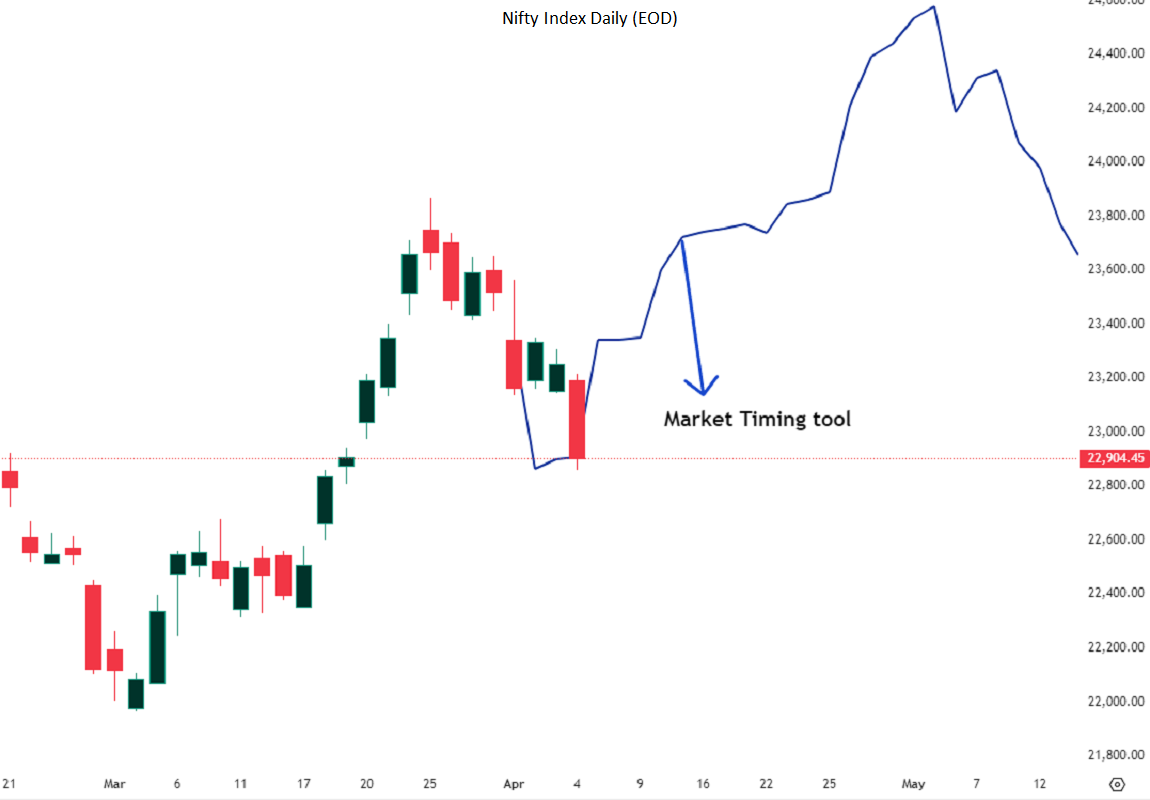
- Upon finding the most similar past pattern, the subsequent historical movement is normalized relative to session opening and plotted onto the current chart using projection lines.
- The projection automatically adapts to intraday, daily, weekly, or monthly timeframes, with the option for manual or automatic projection length settings.
- Session start detection is handled automatically based on volume thresholds and price-time analysis to adjust for market openings across different instruments.
Who May Benefit:
-
- Traders studying market structure repetition and price symmetry.
- Visual thinkers who prefer scenario-based planning over fixed indicator systems.
- Intraday, swing, and position traders looking for historical context to complement price action, volume, and momentum studies.
How to Use:
-
Apply the script to any asset — including indices, stocks, commodities, forex, or crypto.
- Select your preferred timeframe.
- Choose "Auto" or "Custom" for the projection length.
- Observe the projected lines:
- Upward slope = Historical bullish continuation.
- Downward slope = Historical bearish continuation.
- Flat movement = Historical sideways movement.
- Combine insights with volume, support/resistance, and price action for better decision-making.
For best results, combine this tool with price action studies, volume analysis, and momentum indicators.
Important Notes:
- This script does not predict the future. It offers a visual reference based on historical similarity.
- Always validate projected scenarios with live market conditions.
- Market structure evolves; past behavior may not repeat under new market dynamics.
- Use this tool for educational and research purposes only.
Disclaimer:
This is not financial advice. The Market Timing (Mastersinnifty) tool is intended for research and educational purposes only. Trading involves risk, and past performance does not guarantee future results. Always apply sound risk management practices.
To view the indicator in Tradingview: Click here
2. MastersCycleSignal (Mastersinnifty)
Overview
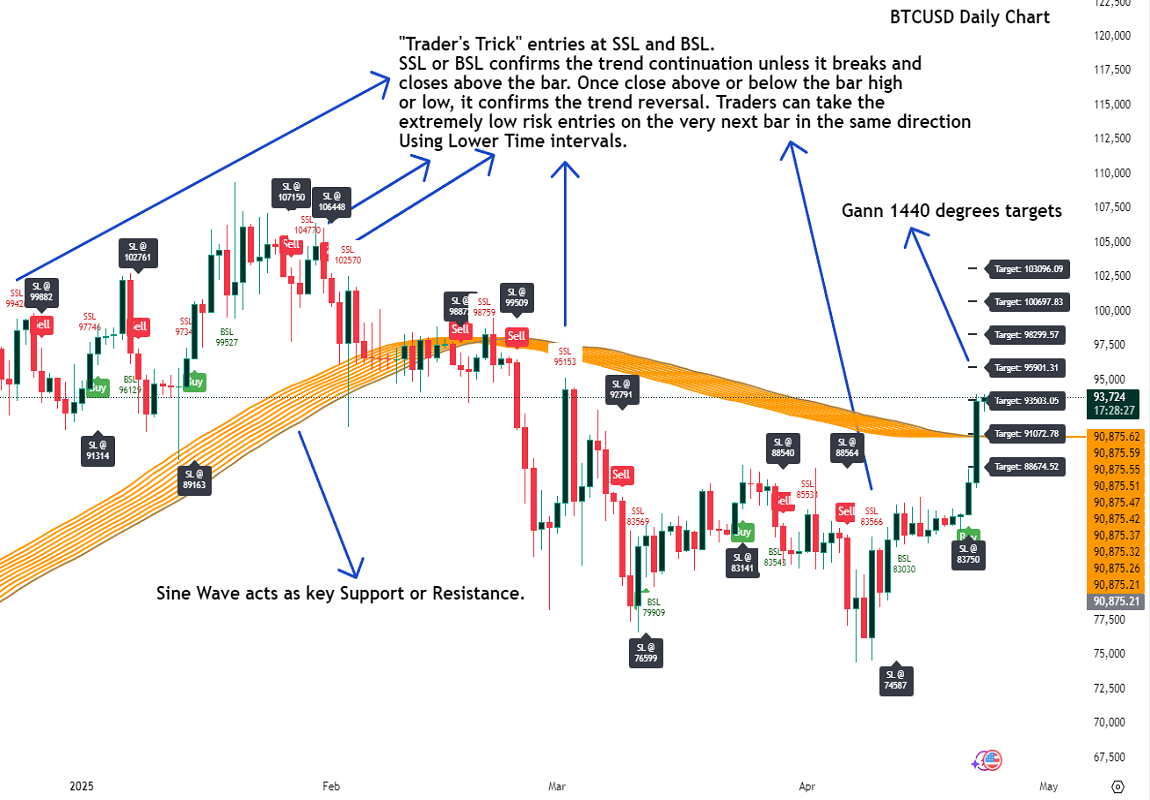
MastersCycleSignal is a high-precision market timing and projection indicator for trend-following and swing traders.
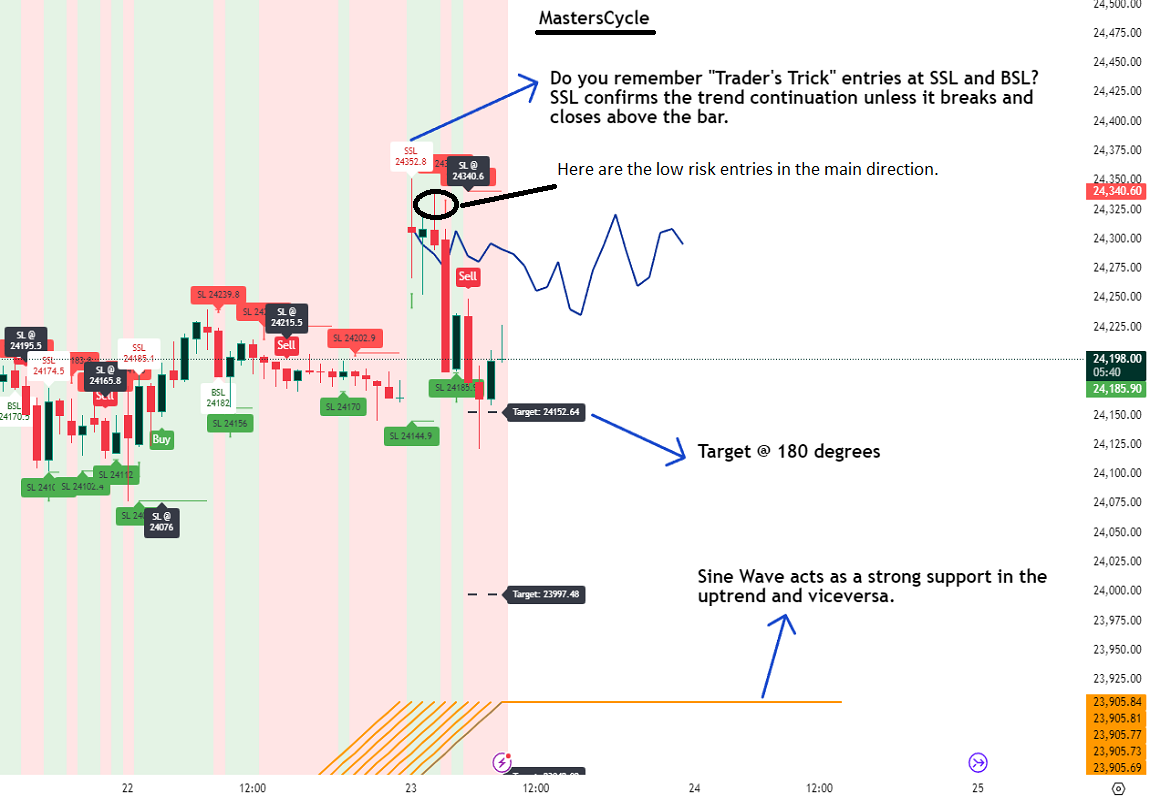
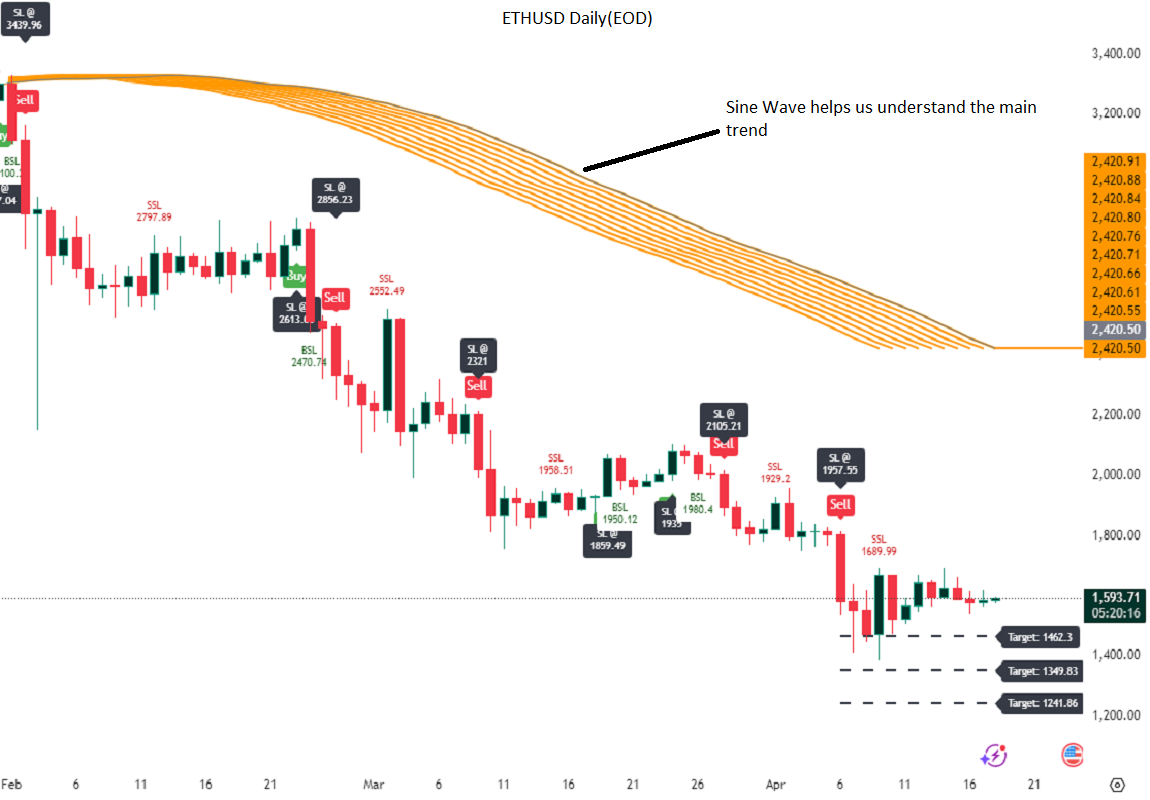
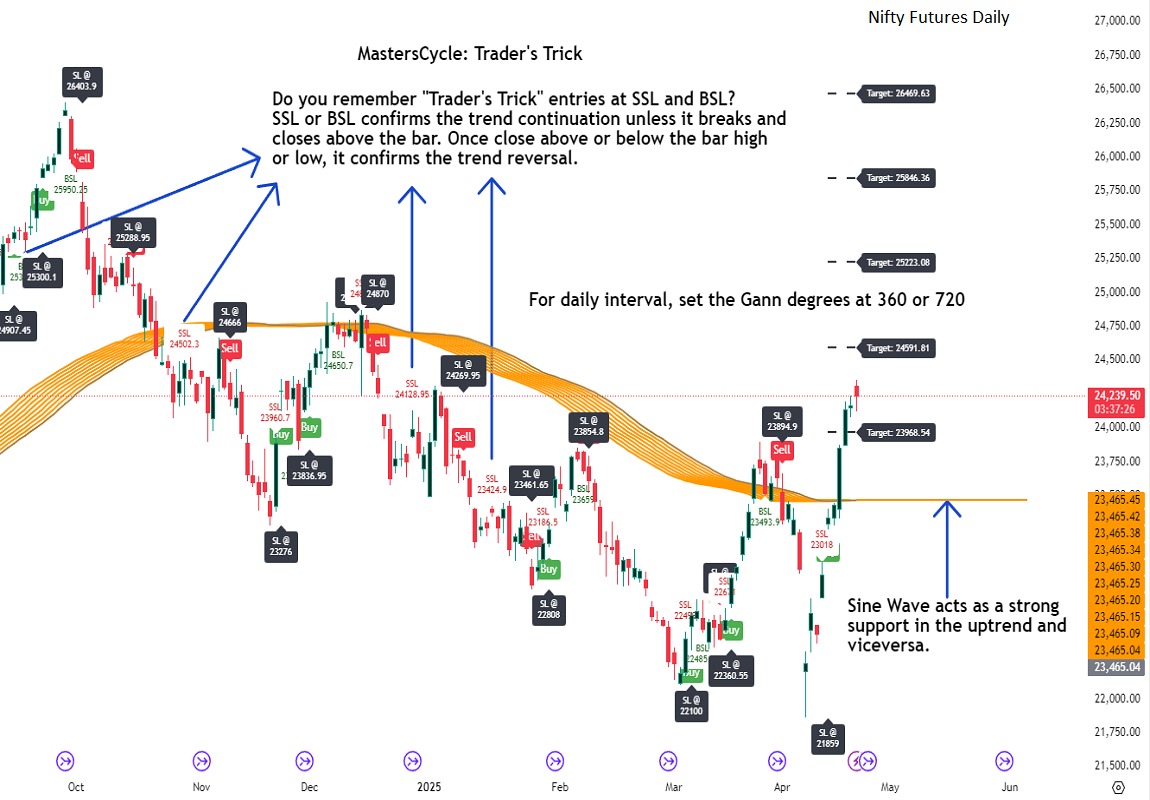
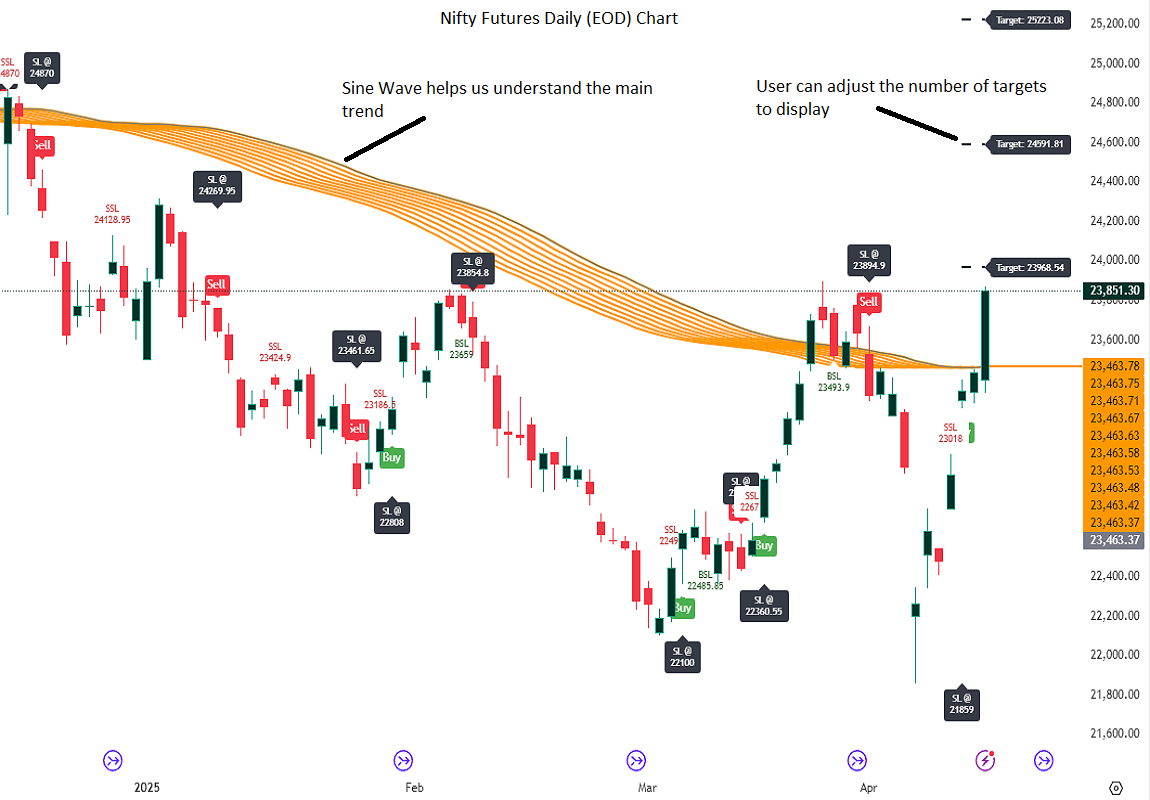
It combines an adaptive cycle detection algorithm, forward-looking sine wave projections, dynamic momentum confirmation, and Gann Square of 9-based geometric targets into a complete structured trading framework.
The script continuously analyzes price oscillations to detect dominant cycles, projects expected price behavior with future-facing sine approximations, and generates buy/sell signals once confirmed by adaptive momentum filtering.
Upon confirmation, it calculates mathematically consistent Gann-based target levels and risk-managed stop-loss suggestions.
Users also benefit from auto-extending targets as price action unfolds — helping traders anticipate rather than react to market shifts.
Uniqueness:
MastersCycleSignal stands apart through a unique fusion of techniques:
- Dynamic Cycle Detection
- Detects dominant cycles using a cosine correlation maximization method between detrended price (close minus SMA) and theoretical cosine curves, dynamically recalibrated across a sliding window.
- Sine Wave Future Projection
- Smooths and projects future price paths by approximating a forward sine wave based on the real-time detected dominant cycle.
- Adaptive Momentum Filtering
- Volatility is scaled by divergence between normalized returns and a 5-period EMA, further adjusted by an RSI(2) factor.
- This makes buy/sell signal confirmation robust against noise and false breakouts.
- Gann-Based Target Computation
- Uses a square-root transformation of price, incremented by selectable Gann Square of 9 degrees, for calculating progressive and dynamically expanding price targets.
- Auto-Extending Targets
- As price achieves a projected target, the system automatically draws subsequent new targets based on the prior target differential — providing continuous guidance in trending conditions.
Usefulness:
MastersCycleSignal is built to help traders:
- Identify early trend reversals through cycle shifts.
- Forecast probable price paths in advance.
- Plan systematic target and stop-loss zones with geometric accuracy.
- Reduce guesswork in trend-following and swing trading.
- Maintain structured discipline across intraday, swing, and positional strategies.
It works seamlessly across stocks, indices, forex, commodities, and crypto markets — on any timeframe.
How to use:
- Attach the indicator to your desired chart.
- When a Buy Signal or Sell Signal appears (green or red markers):
- Use the attached stop-loss labels to manage risk.
- Monitor the automatically plotted target lines for partial exits or full profits.
- The orange projected sine wave illustrates the expected future market path.
- Customization Options:
- Cycle Detection Length — adjust to fine-tune cycle sensitivity.
- Projection Length — modify the forward distance of sine wave forecast.
- Gann Square of 9 Degrees — personalize target increments.
- Toggle Signals and Target visibility as needed.
Disclaimer:
- MastersCycleSignal uses no future data or lookahead bias.
- All projections are based on geometric extrapolations from historical price action — not guaranteed predictions.
- Trading involves risks, and historical cycle behavior may differ in future conditions.
To view indicator in the Tradingview: Click here
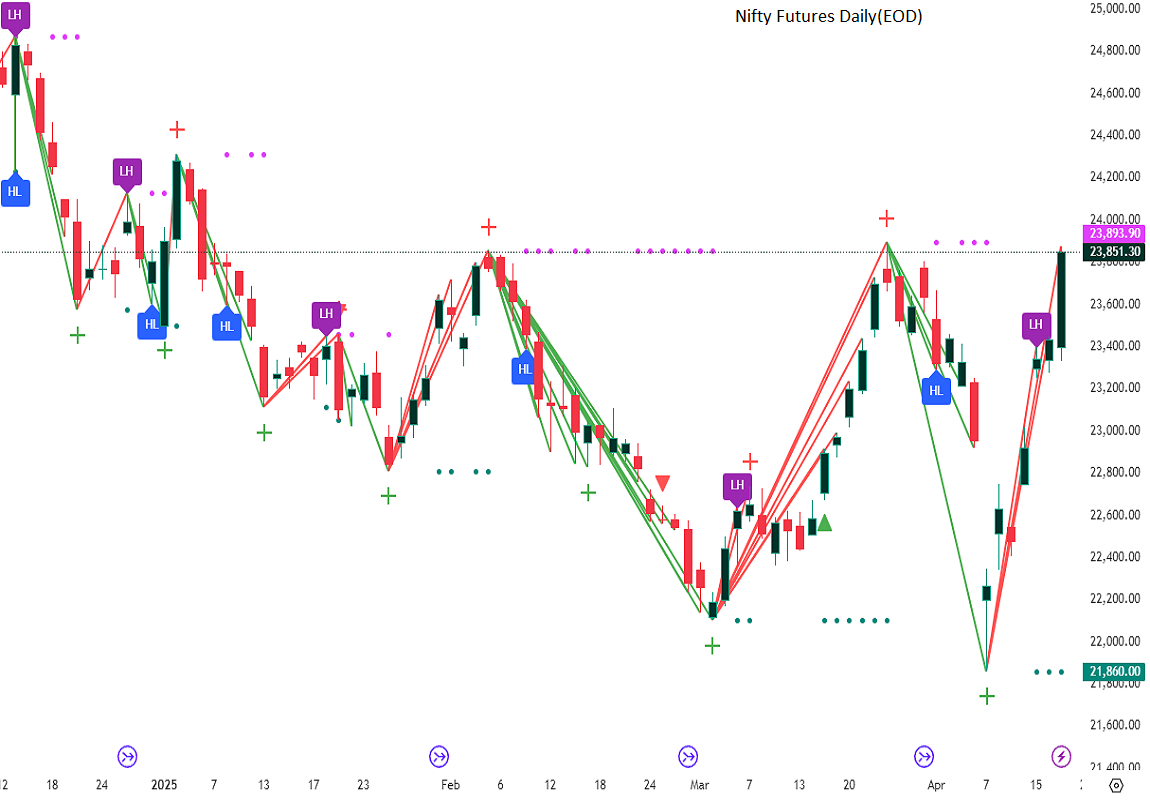
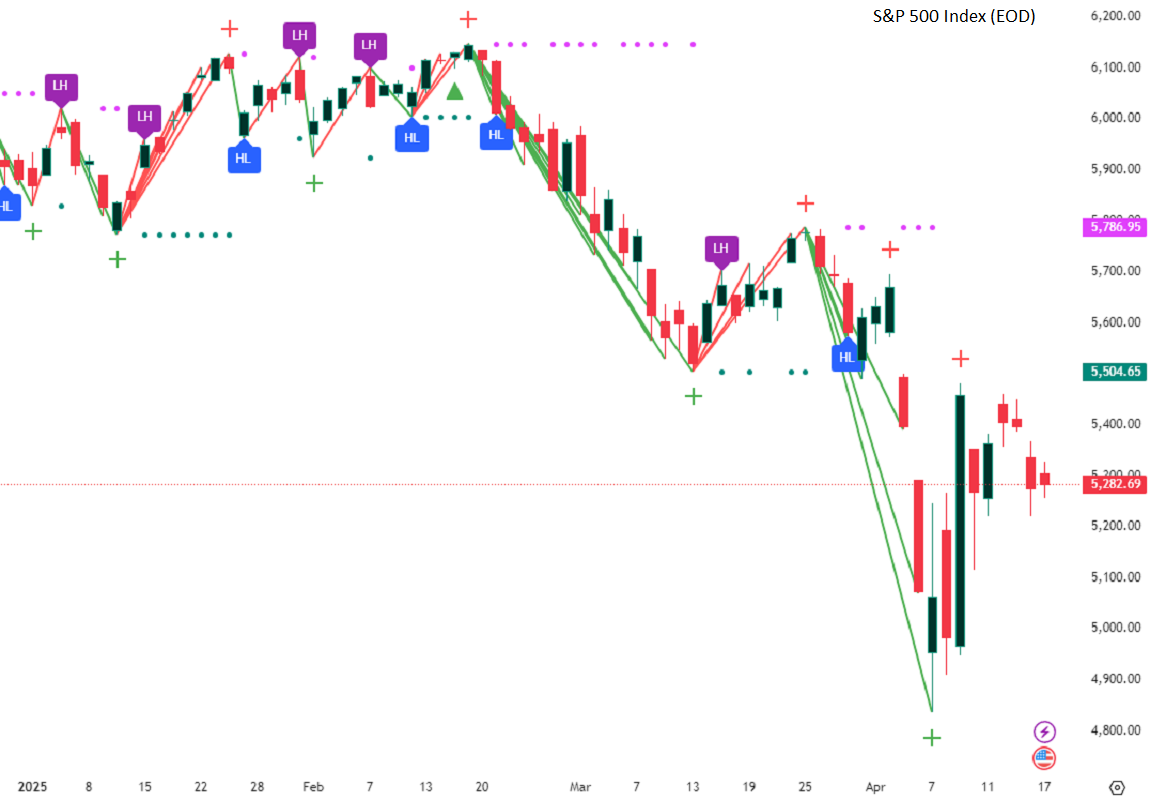
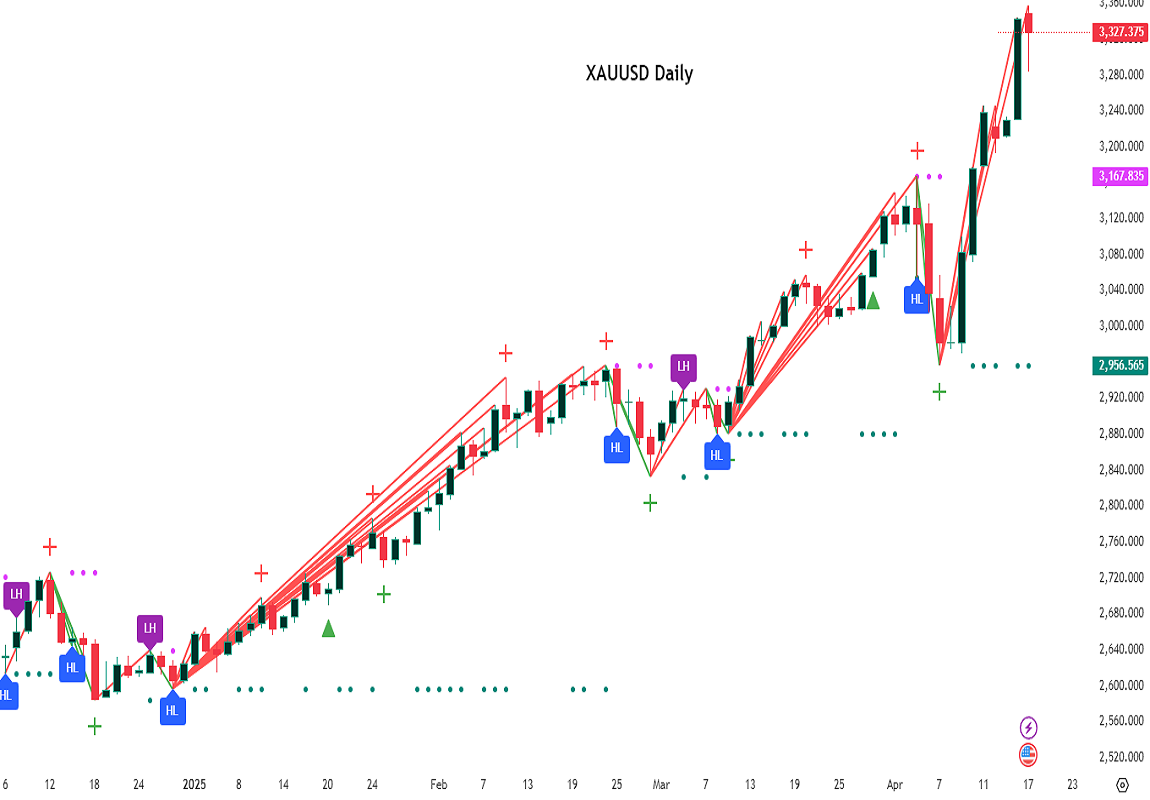
3. Indicator Name: Swing + 3-Bar Breakout (Mastersinnifty)
Overview:
This script is a hybrid trading tool combining swing-based structural analysis, momentum filtering, and breakout validation — designed to detect early reversals and confirm trend continuations within a single unified system.
It integrates five major components:
- ZigZag Structural Detection — to identify critical swing highs and lows.
- Momentum Validation — using RSI and Rate of Change (ROC) to confirm the strength behind swings.
- Three-Bar Breakout Confirmation — spotting trend continuation beyond swing structures.
- Dynamic Trailing Stop System — managing trades adaptively via ATR-based trailing stops.
- Projected Target Levels — estimating future price destinations based on measured swings.
What Makes This Script Unique
Rather than using standard indicators in isolation, this script layers multiple conditions sequentially and contextually:
- Structural Foundation: Identifies pivots through a tight ZigZag algorithm tuned with a low-depth setting for early detection.
- Momentum Checkpoint: Validates pivots only if RSI extremes and ROC momentum surges align, reducing false breakouts during sideways movements.
- Breakout Validation: Confirms trend continuation when price breaches critical multi-bar highs/lows post-swing formation.
- Risk-Managed Progression: Initiates adaptive ATR-based trailing stops immediately after signal generation, tightening risk dynamically as trends unfold.
- Target Projection: Estimates potential move size by projecting the magnitude of the last completed swing, offering realistic price milestones.
This combination provides a dual-purpose tool for both reversals and breakouts, allowing flexible trading styles within a single indicator.
How the Script Works
- Swing Detection
- A swing low is identified when a price bottom forms (via ZigZag) and momentum conditions are met (RSI < 20, ROC > +0.5).
- A swing high is identified when a price top forms and momentum conditions are met (RSI > 80, ROC < -0.5).
- Breakout Confirmation
- After a swing is detected, if price crosses above/below a three-bar swing structure, a secondary breakout signal is triggered.
- Trailing Stop Activation:
- Upon a confirmed swing or breakout, an ATR-multiplied trailing stop is initialized below/above the entry point to secure profits dynamically.
- Projection Logic
- Swing height is measured from the latest high-low sequence, and potential future targets are plotted for visual guidance.
Who Can Benefit From This Indicator
- Swing Traders — who seek early entries around reversal zones.
- Scalpers & Intraday Traders — needing fast-reacting momentum-based confirmation.
- Breakout Traders — to time entries after multi-bar compressions.
- Risk Managers — through integrated ATR trailing stops for dynamic exit management.
- Price Action Analysts — utilizing projected swing targets for strategic planning.
How to Use
- Entry Identification
- Look for buy signals at swing lows with strong positive momentum.
- Look for sell signals at swing highs with strong negative momentum.
- Use breakout confirmations to validate the trend continuation beyond swings.
- Risk Management
- Monitor trailing stop lines to track trade health.
- Watch projected targets to anticipate realistic move completions.
- Chart Visibility
- All plotted points, breakout markers, trailing stops, and projected levels are generated automatically for clarity.
Disclaimer
This script is intended for educational and analytical purposes only.
It does not constitute financial advice, and past performance does not guarantee future results.
All trading involves risk. Users are responsible for their own trading decisions.
To view indicator in the Tradingview: Click here
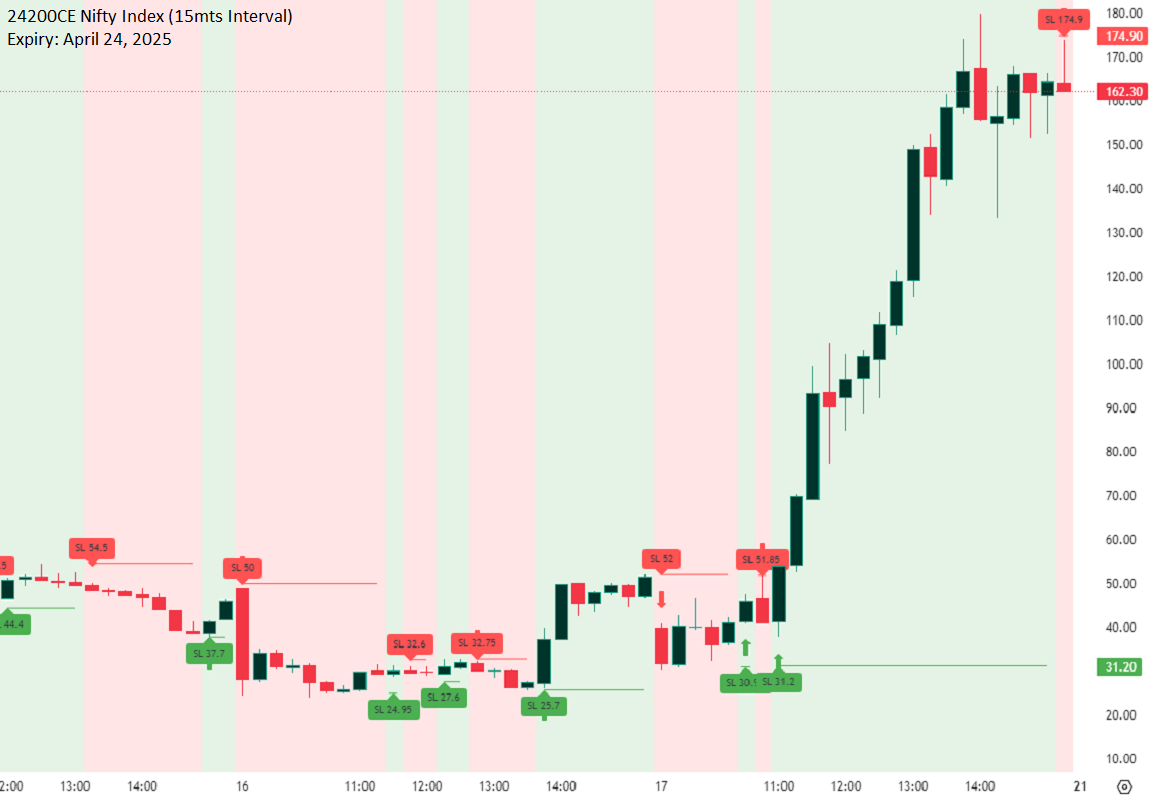
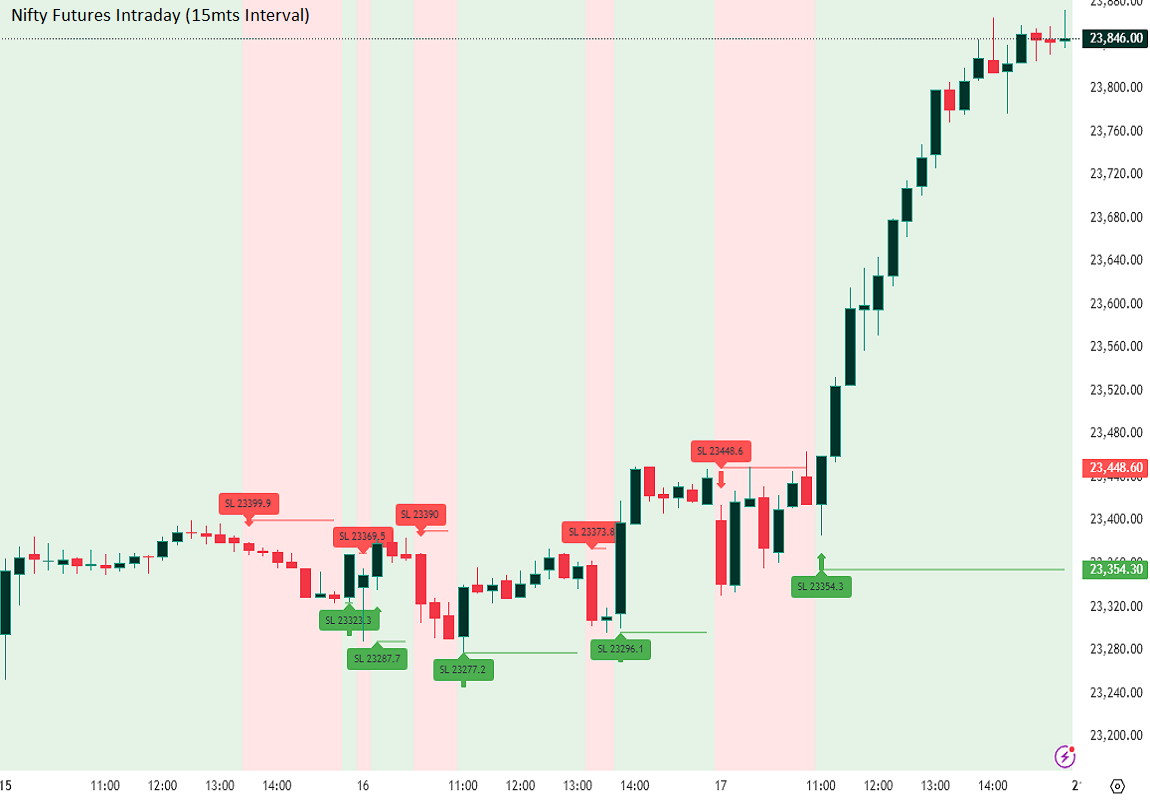
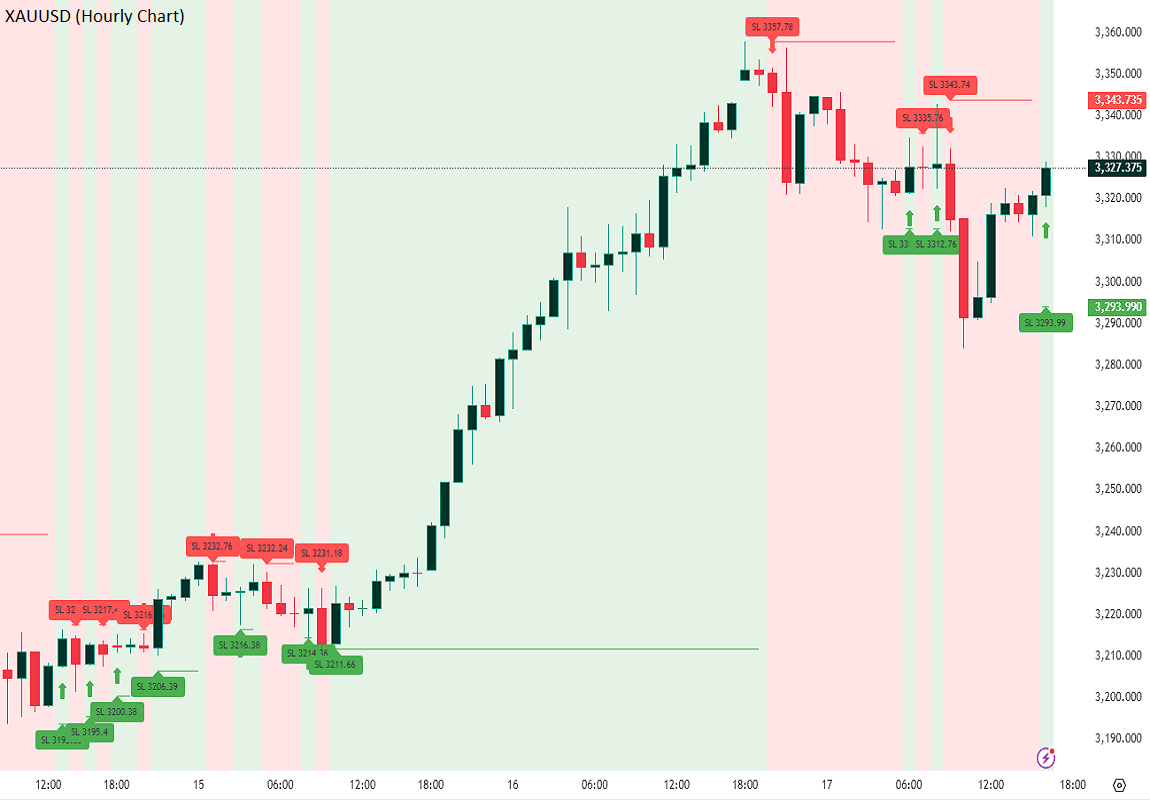
4. Script Name: Swing High/Low Scalper (Mastersinnifty)
Overview:
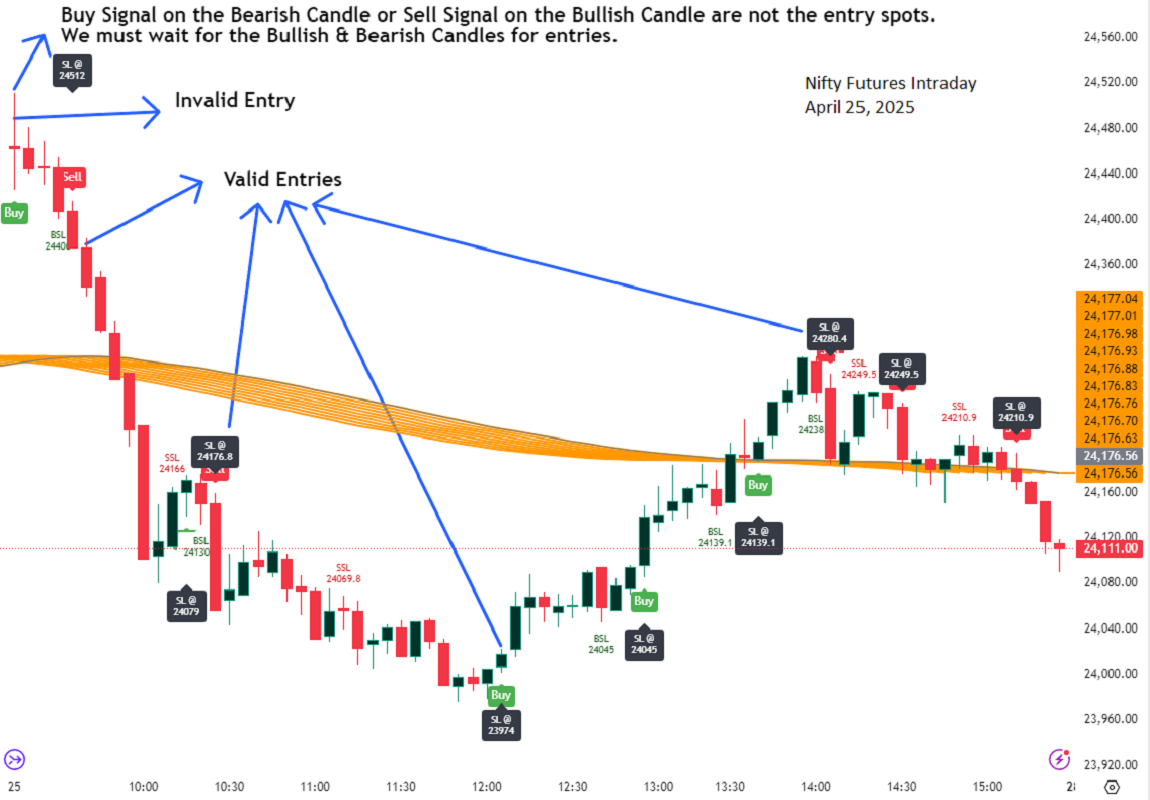
The Swing High/Low Scalper is designed for traders seeking structured entries and disciplined stop-loss planning during momentum shifts. It combines smoothed Force Index readings with swing high/low analysis to identify moments where both momentum and structural price levels align.
When a new directional bias is confirmed, the indicator plots clear entry signals and dynamically calculates the nearest logical stop-loss level based on recent swing points.
---
Core Logic
- Force Index Bias Detection
- The Force Index (price × volume change) is smoothed with an EMA to determine sustained bullish or bearish momentum.
- Signal Memory and Noise Reduction
- The indicator remembers the last signal (buy/sell) and only triggers a new signal when the bias changes, helping avoid redundant entries in sideways or noisy conditions.
- Swing-based Stop-Loss Calculation
- Upon signal confirmation, the script automatically plots a stop-loss label near the most recent swing low (for buys) or swing high (for sells).
- If conditions are extreme, fallback safety checks are used to validate the stop-loss placement.
---
Key Features
- Dynamic, structure-based stop-loss plots at every trade signal.
- Visual background bias:
- Green tint = Bullish bias
- Red tint = Bearish bias
- Minimalist and clean chart visualization for easy interpretation.
- Designed for scalability across timeframes (from 1-minutes to daily charts).
---
Why It’s Unique
- Unlike simple momentum oscillators or swing indicators, this tool integrates a state-tracking mechanism.
- A signal is only generated when a true shift in directional force occurs and swing structure supports the move, seeking to catch only meaningful changes rather than every minor fluctuation.
- This dual-filter approach emphasizes quality over quantity, aiming for disciplined entries with risk levels derived from actual price behavior, not arbitrary formulas.
---
How to Use
- Apply the Script to your desired chart and timeframe.
- Look for Signals:
- Green Up Arrow = Buy Signal
- Red Down Arrow = Sell Signal
- Observe Stop-Loss Labels
- Use the plotted SL labels for setting exit points based on recent swing structure.
- Monitor Background Bias:
- Green or Red background hints at prevailing directional momentum.
---
Important Disclaimer
This tool is intended to assist technical analysis and trade planning.
It does not provide financial advice or guarantee any future performance.
Always use additional risk management practices when trading.
To view the indicator in Tradingview: Click here
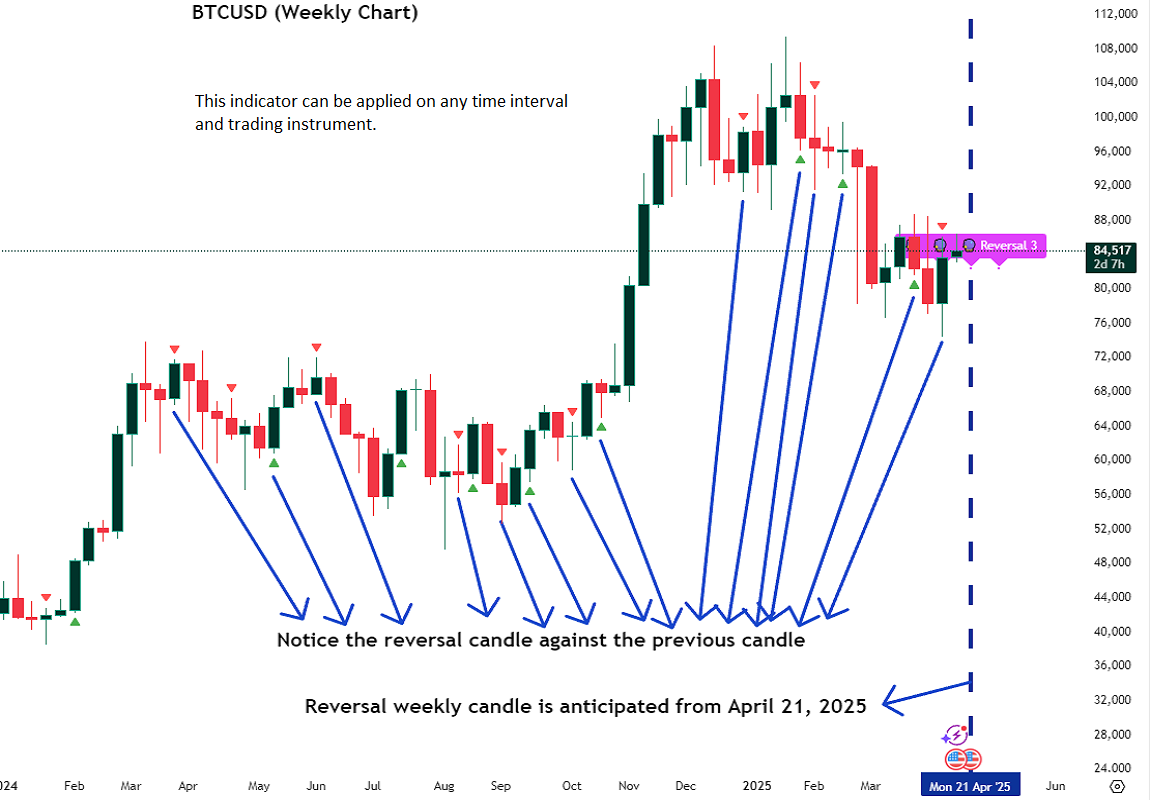
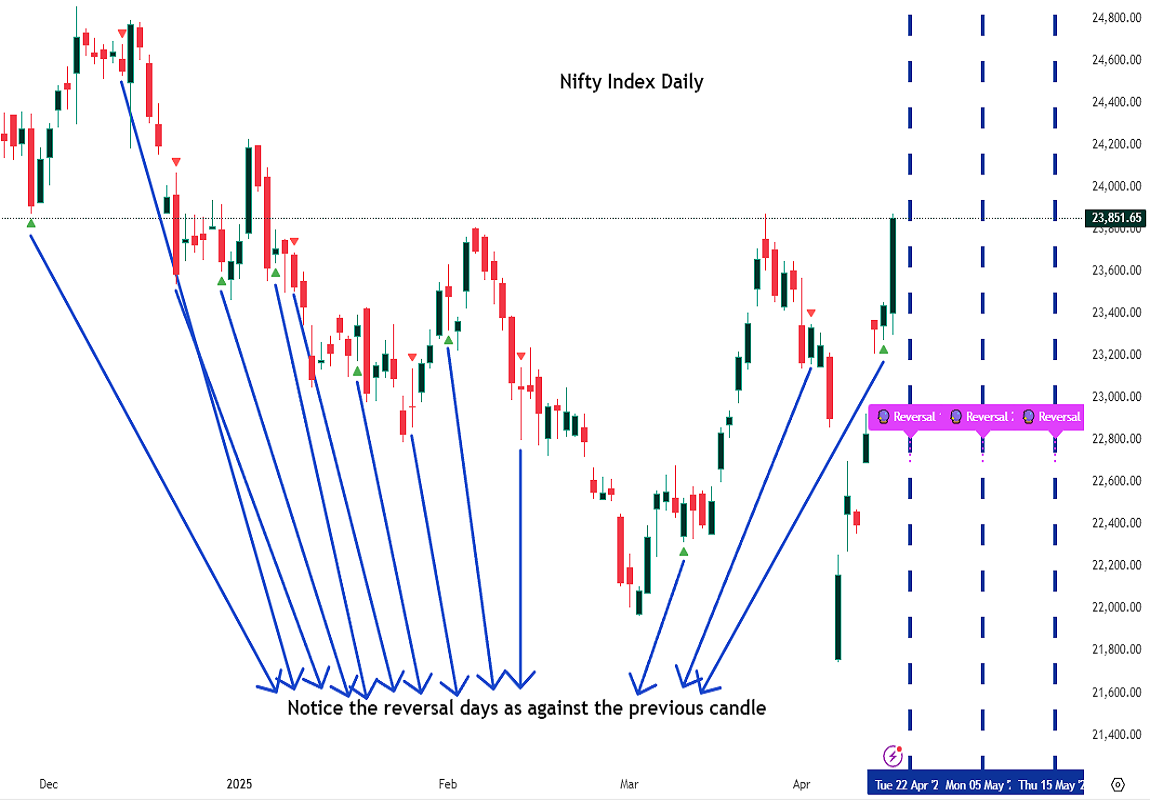
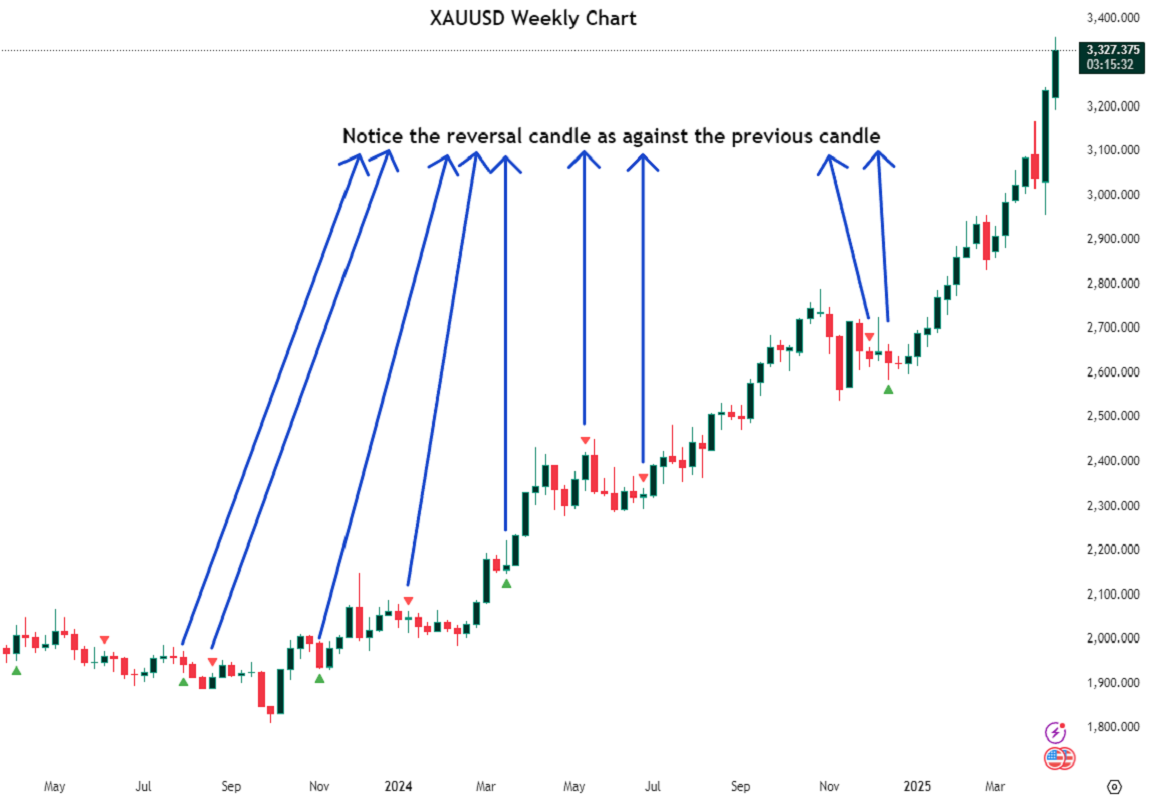
5. Script Name: Future Candle Reversal Projection (Mastersinnifty)
Overview:
This tool identifies potential future market reversal zones by dynamically projecting pivot-based swing patterns forward in time. Unlike traditional ZigZag indicators that only reflect past movements, this indicator anticipates probable future turning points based on historical swing periodicity.
---
Key Features
- Forward Projections: Calculates and projects future swing zones based on detected pivot distances.
- Customizable Detection: Adjust the ZigZag depth for different trading styles (scalping, swing, position).
- Dynamic Updates: Real-time recalibration as new pivots form.
- Clean Visual Markers: Projects reversal estimates as intuitive labels and dotted lines.
---
How it Works
The indicator identifies significant swing highs and lows using a user-defined ZigZag depth setting. It measures the time (bars) and price characteristics of the latest swing movement. Using this pattern, it projects forward estimated reversal points at consistent intervals. Midpoint price levels between the last high and low are used for each future projection.
---
Who Can Benefit
- Intraday and swing traders seeking advanced planning zones.
- Technical analysts relying on pattern periodicity.
- Traders who wish to combine projected reversal markers with their own risk management strategies.
---
Disclaimer
This tool is an analytical and educational utility. It does not predict markets with certainty. Always combine it with your own analysis and risk management. Past behavior does not guarantee future results.
To view the indicator in Tradingview: Click here